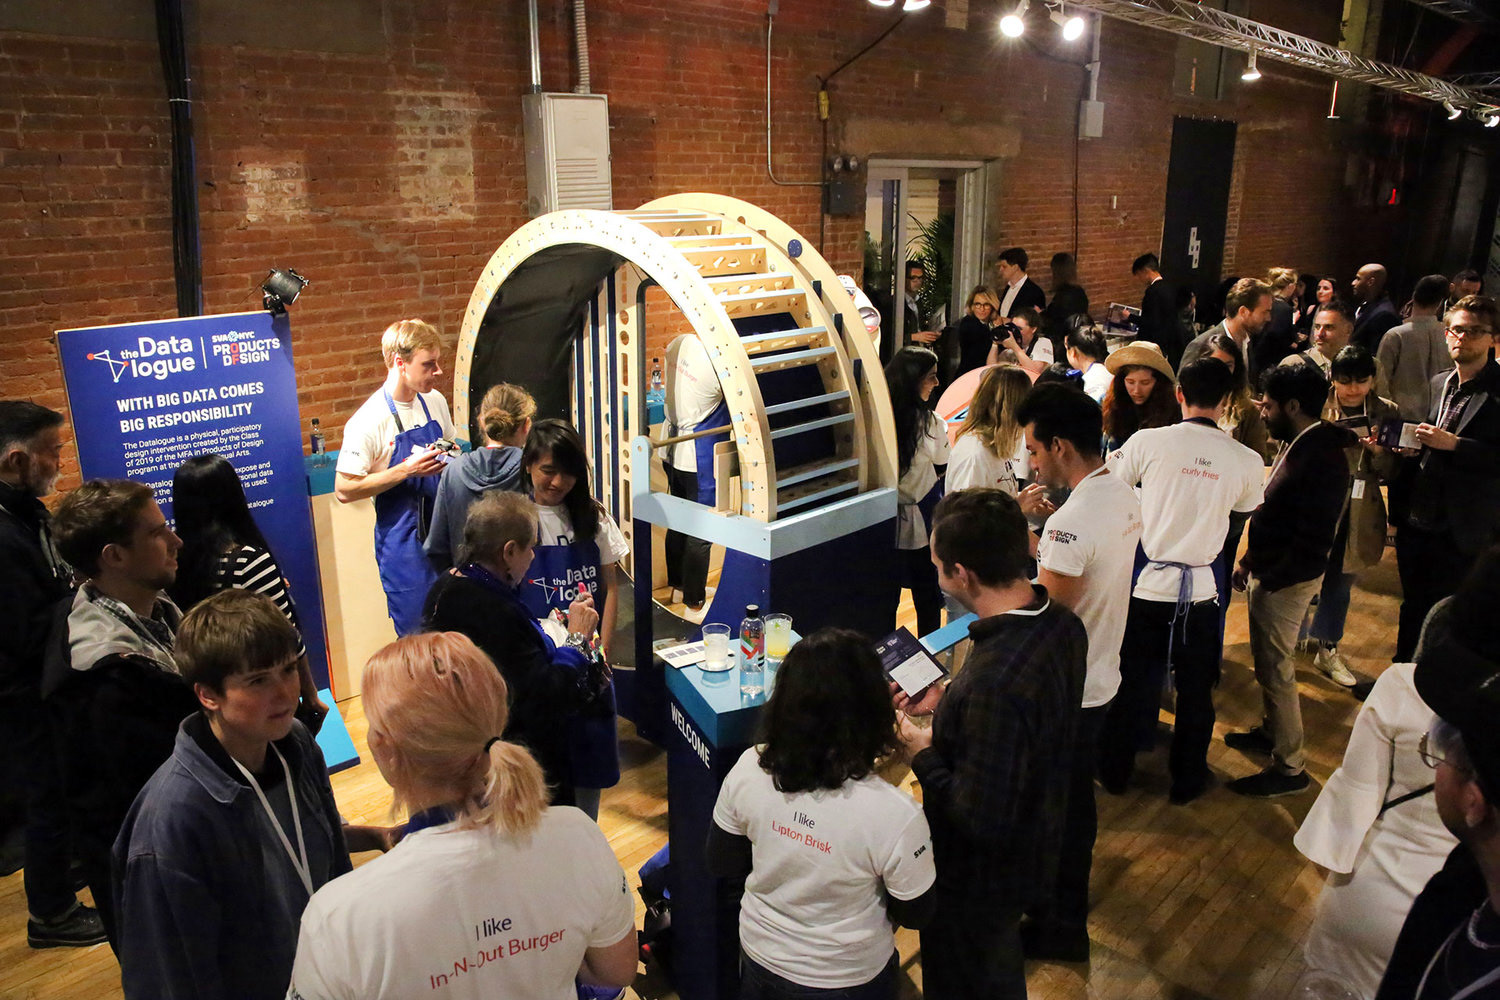


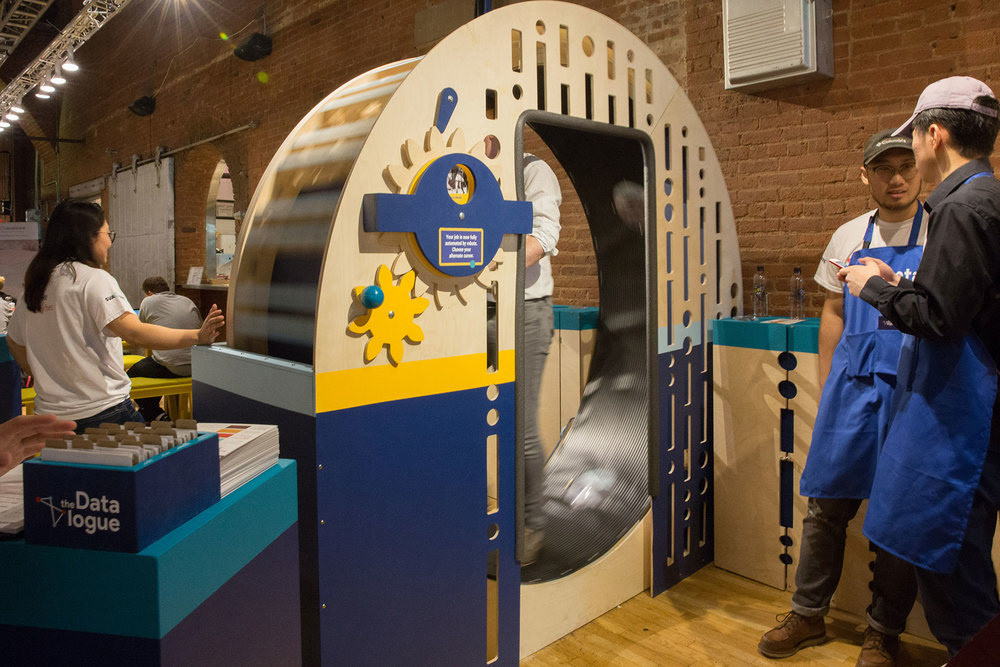
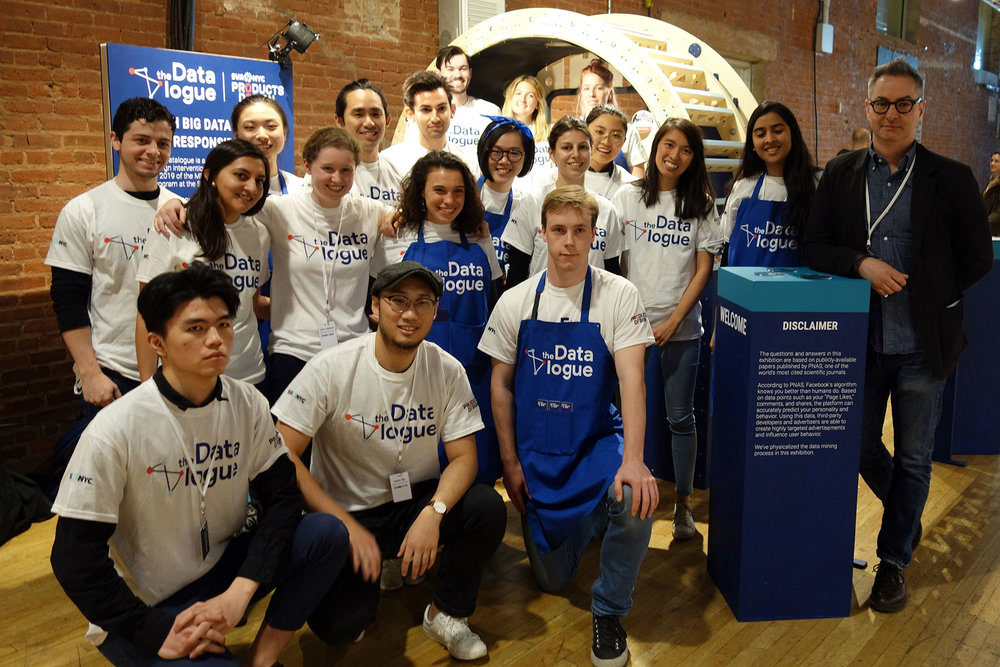
The Datalogue at Wanted Design. Courtesy of SVA MFA in Products of Design

Video by Zihan Chen
Background

Photo by Graeme Jennings/Washington Examiner
In 2017, Cambridge Analytica used Facebook data to influence over 50 million Facebook users in the 2016 election. This led to Mark Zuckerberg's testimony before Congress in the photograph above, after which most people reached the conclusion that no one in that room really had any idea what data is (or even what Facebook is) and what it can do. We decided to learn more about it, and help others do so as well.
In the Cambridge Analytica scandal, a researcher had given Facebook users a personality test, then correlated users' results with their Facebook data. The researcher then illegally sold this information to Cambridge Analytica, who used the correlations to target an enormous number of users with political ads. We were surprised to find out that all of the information from the original study was publicly available (see this study and supplement from the National Academy of Sciences).
More surprising was just how predictive our data really is. The Cambridge studies found that by knowing just ten of your likes, Facebook can know you better than a friend. With 50 likes, it knows you better than your spouse. But what does this really mean?
Well, we're not really sure yet. With the Datalogue, we took the stance that data is a massive force that we may not fully understand and with potential outcomes that we may not be able to fully predict, but the more we know the more empowered we can be for the future.
Process
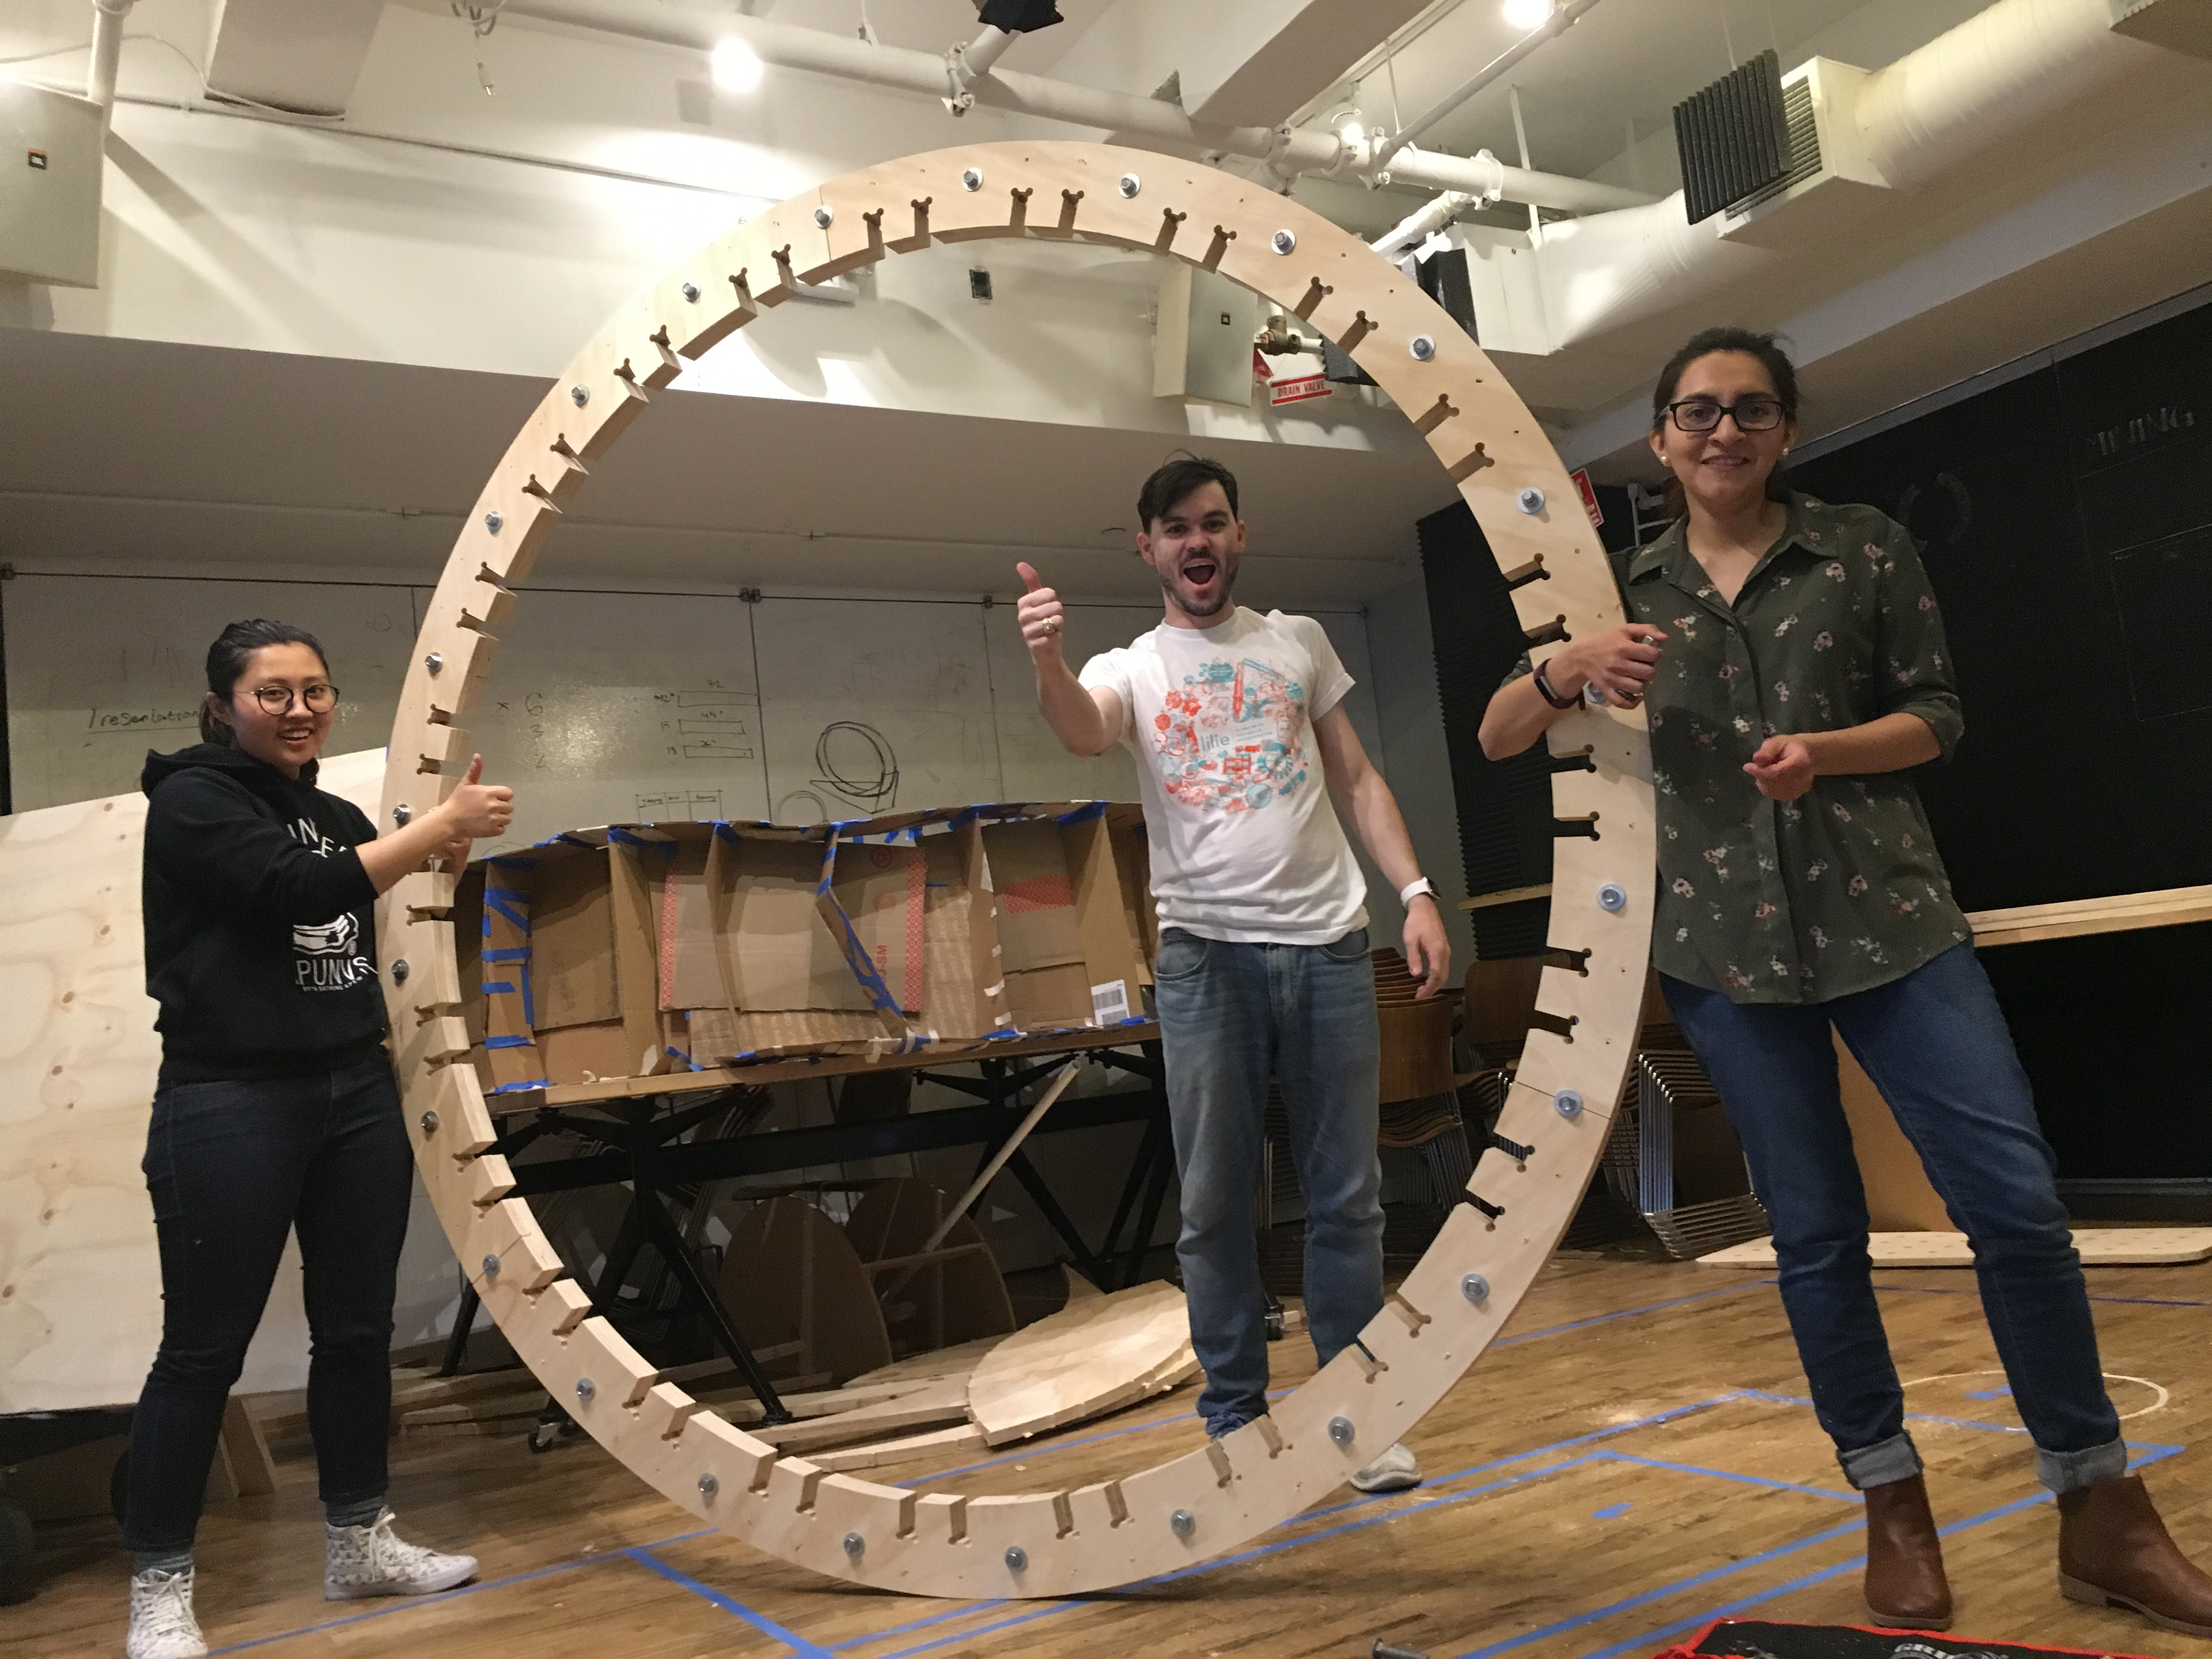
My classmates Xuan Wang, John Boran, and Sophie Carrillo Miranda building the wheel. John was the primary designer for the wheel.
During the 13-week course, we spent the first ten weeks ideating and iterating; the final three weeks were a big sprint to the end. With the brief of creating a personality test in the form of a carnival, Fabrication Team was tasked with designing the interactions, structures, and layout. We sketched, modeled, prototyped in cardboard, and built the structures out of wood and hardware. Our original plan included five structures and a ball-drop/hole-punch mechanism, however we ultimately needed to reduce to four interactive structures and a set of storage cabinets. Every piece was designed for deconstruction, transportation, and heavy use.
Throughout this process, we overcame a number of challenges with ambiguity (we did not know the dimensions of our exhibit space until two weeks before we installed), logistics (budget, personnel, schedules, you name it), and the fact that we were all trying to learn and do brand new things in a very short amount of time and under a lot of pressure from various stakeholders. However, we maintained our patience and commitment to planning and prototyping throughout the process; as a result, very few pieces needed to be re-designed during the final build.
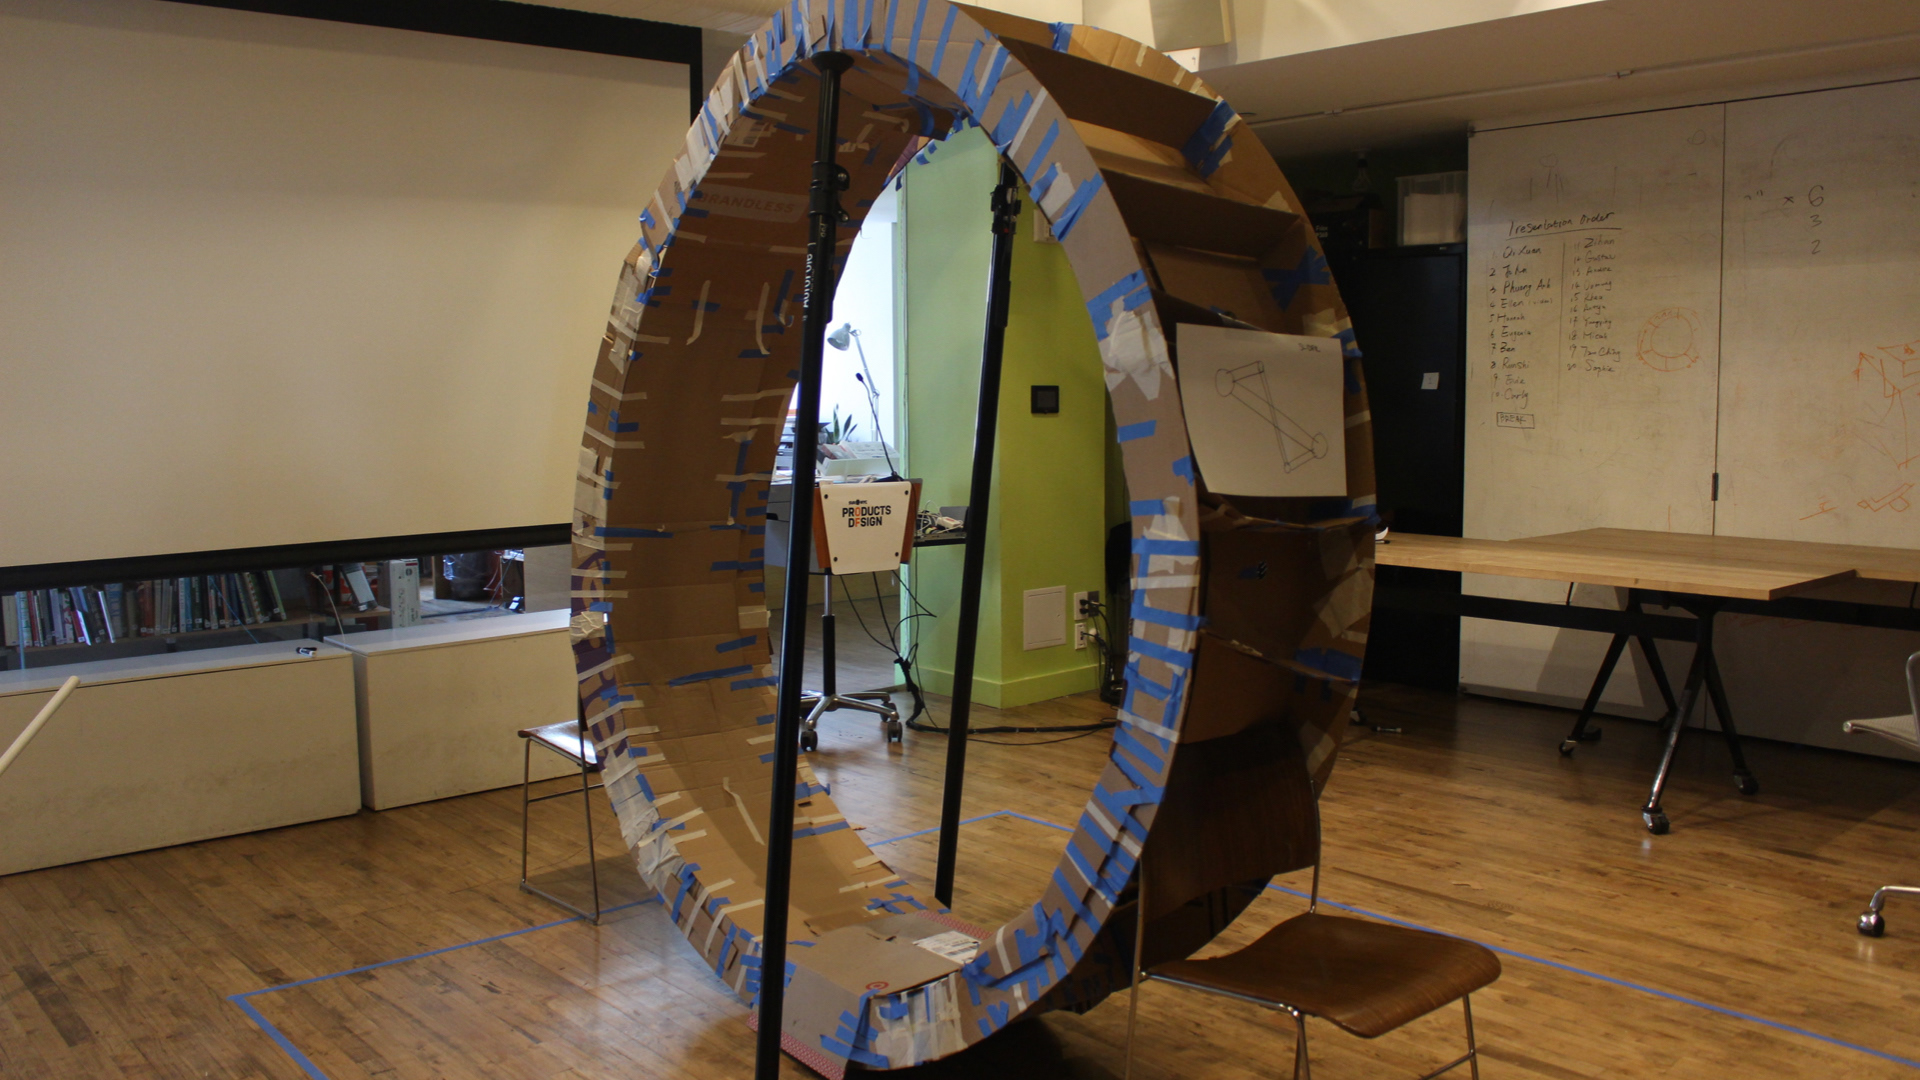
Cardboard hamster wheel mockup for scale and build testing
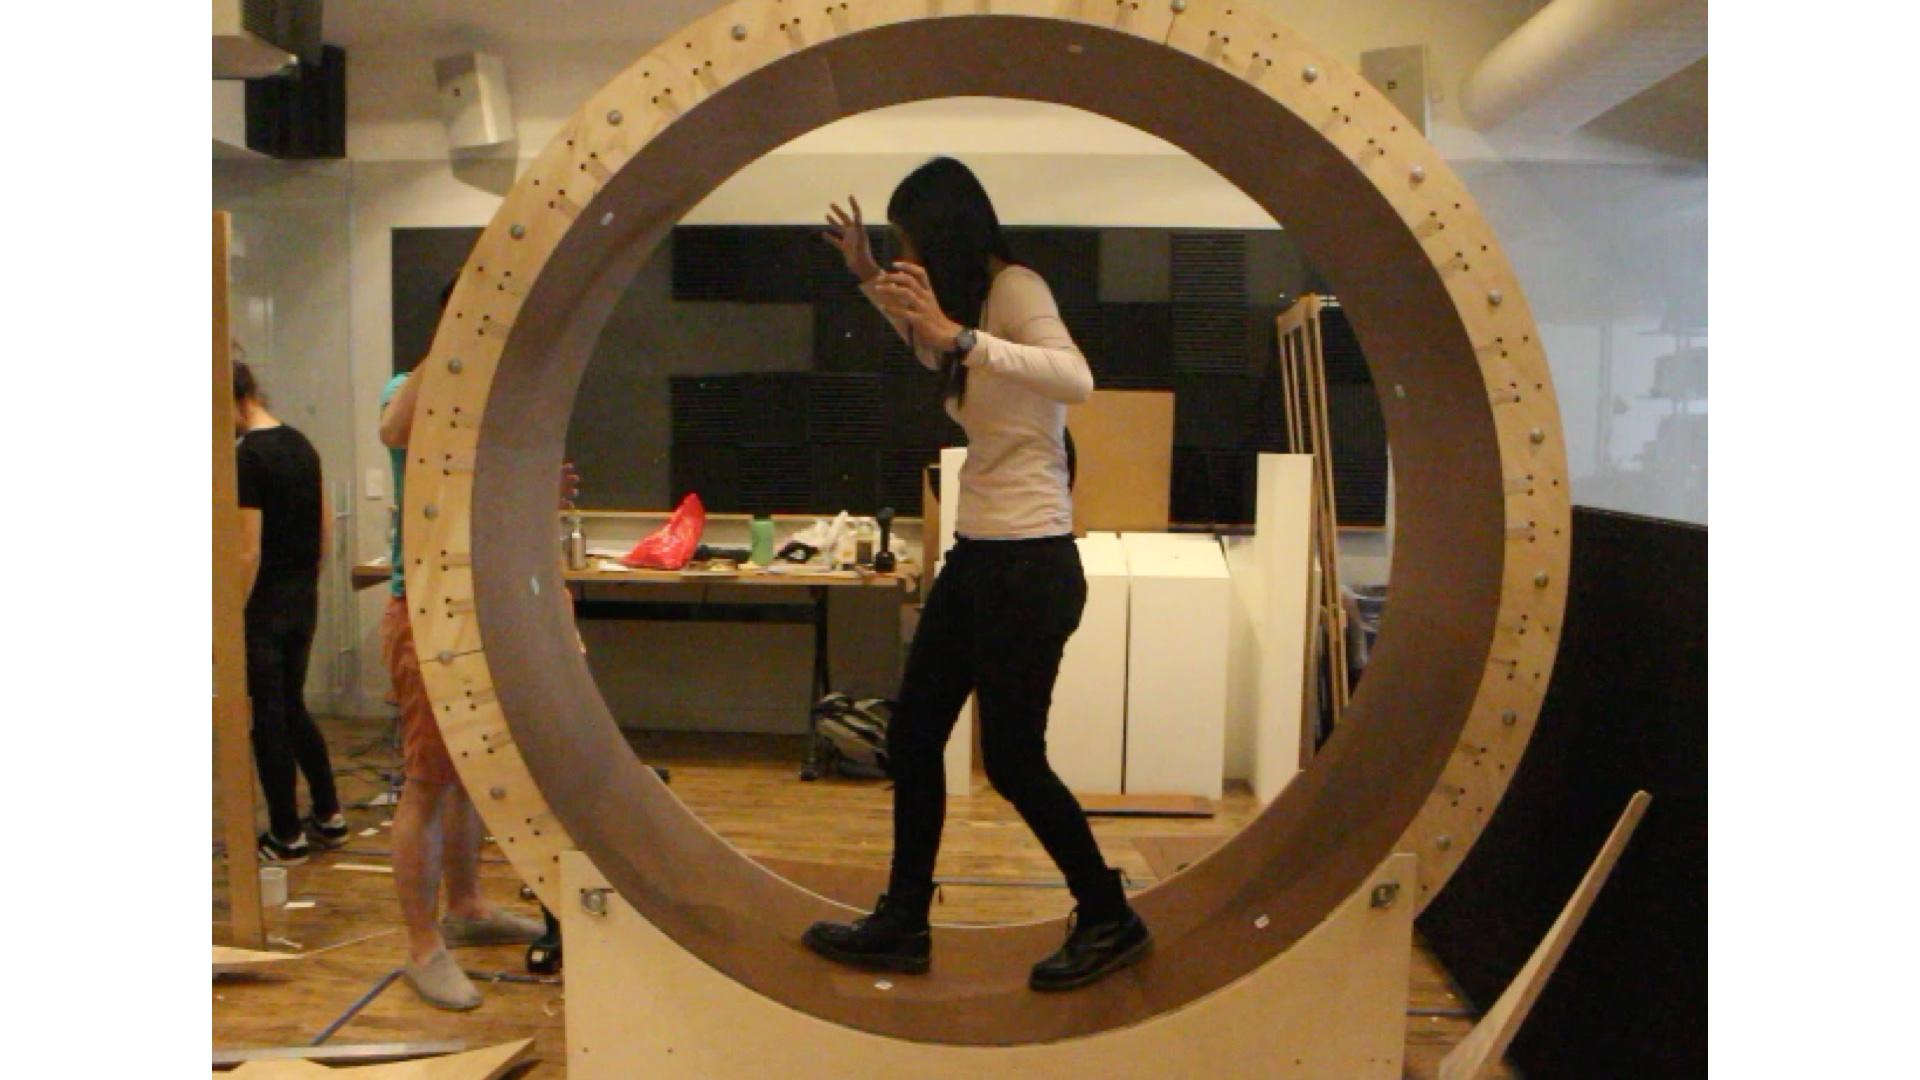
First walk on the wheel
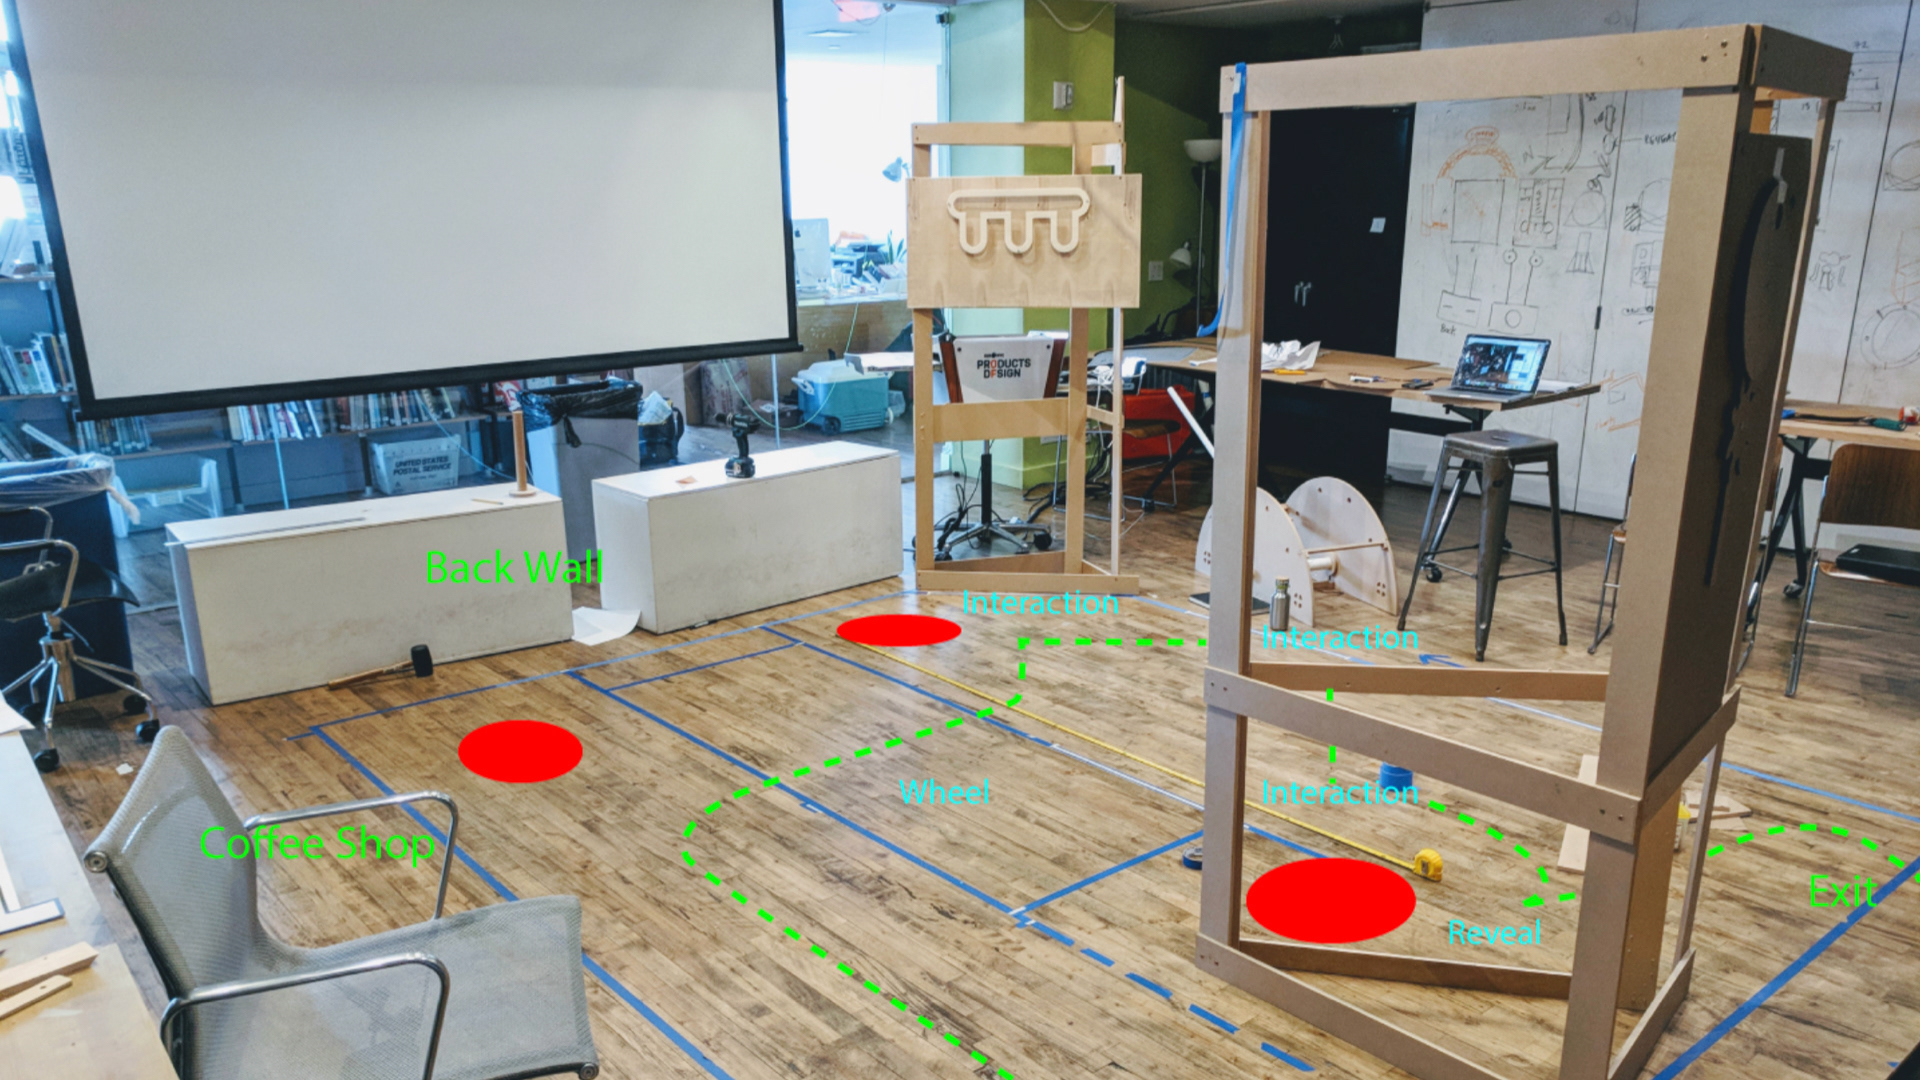
Spatial flow diagram
Early structure footprint
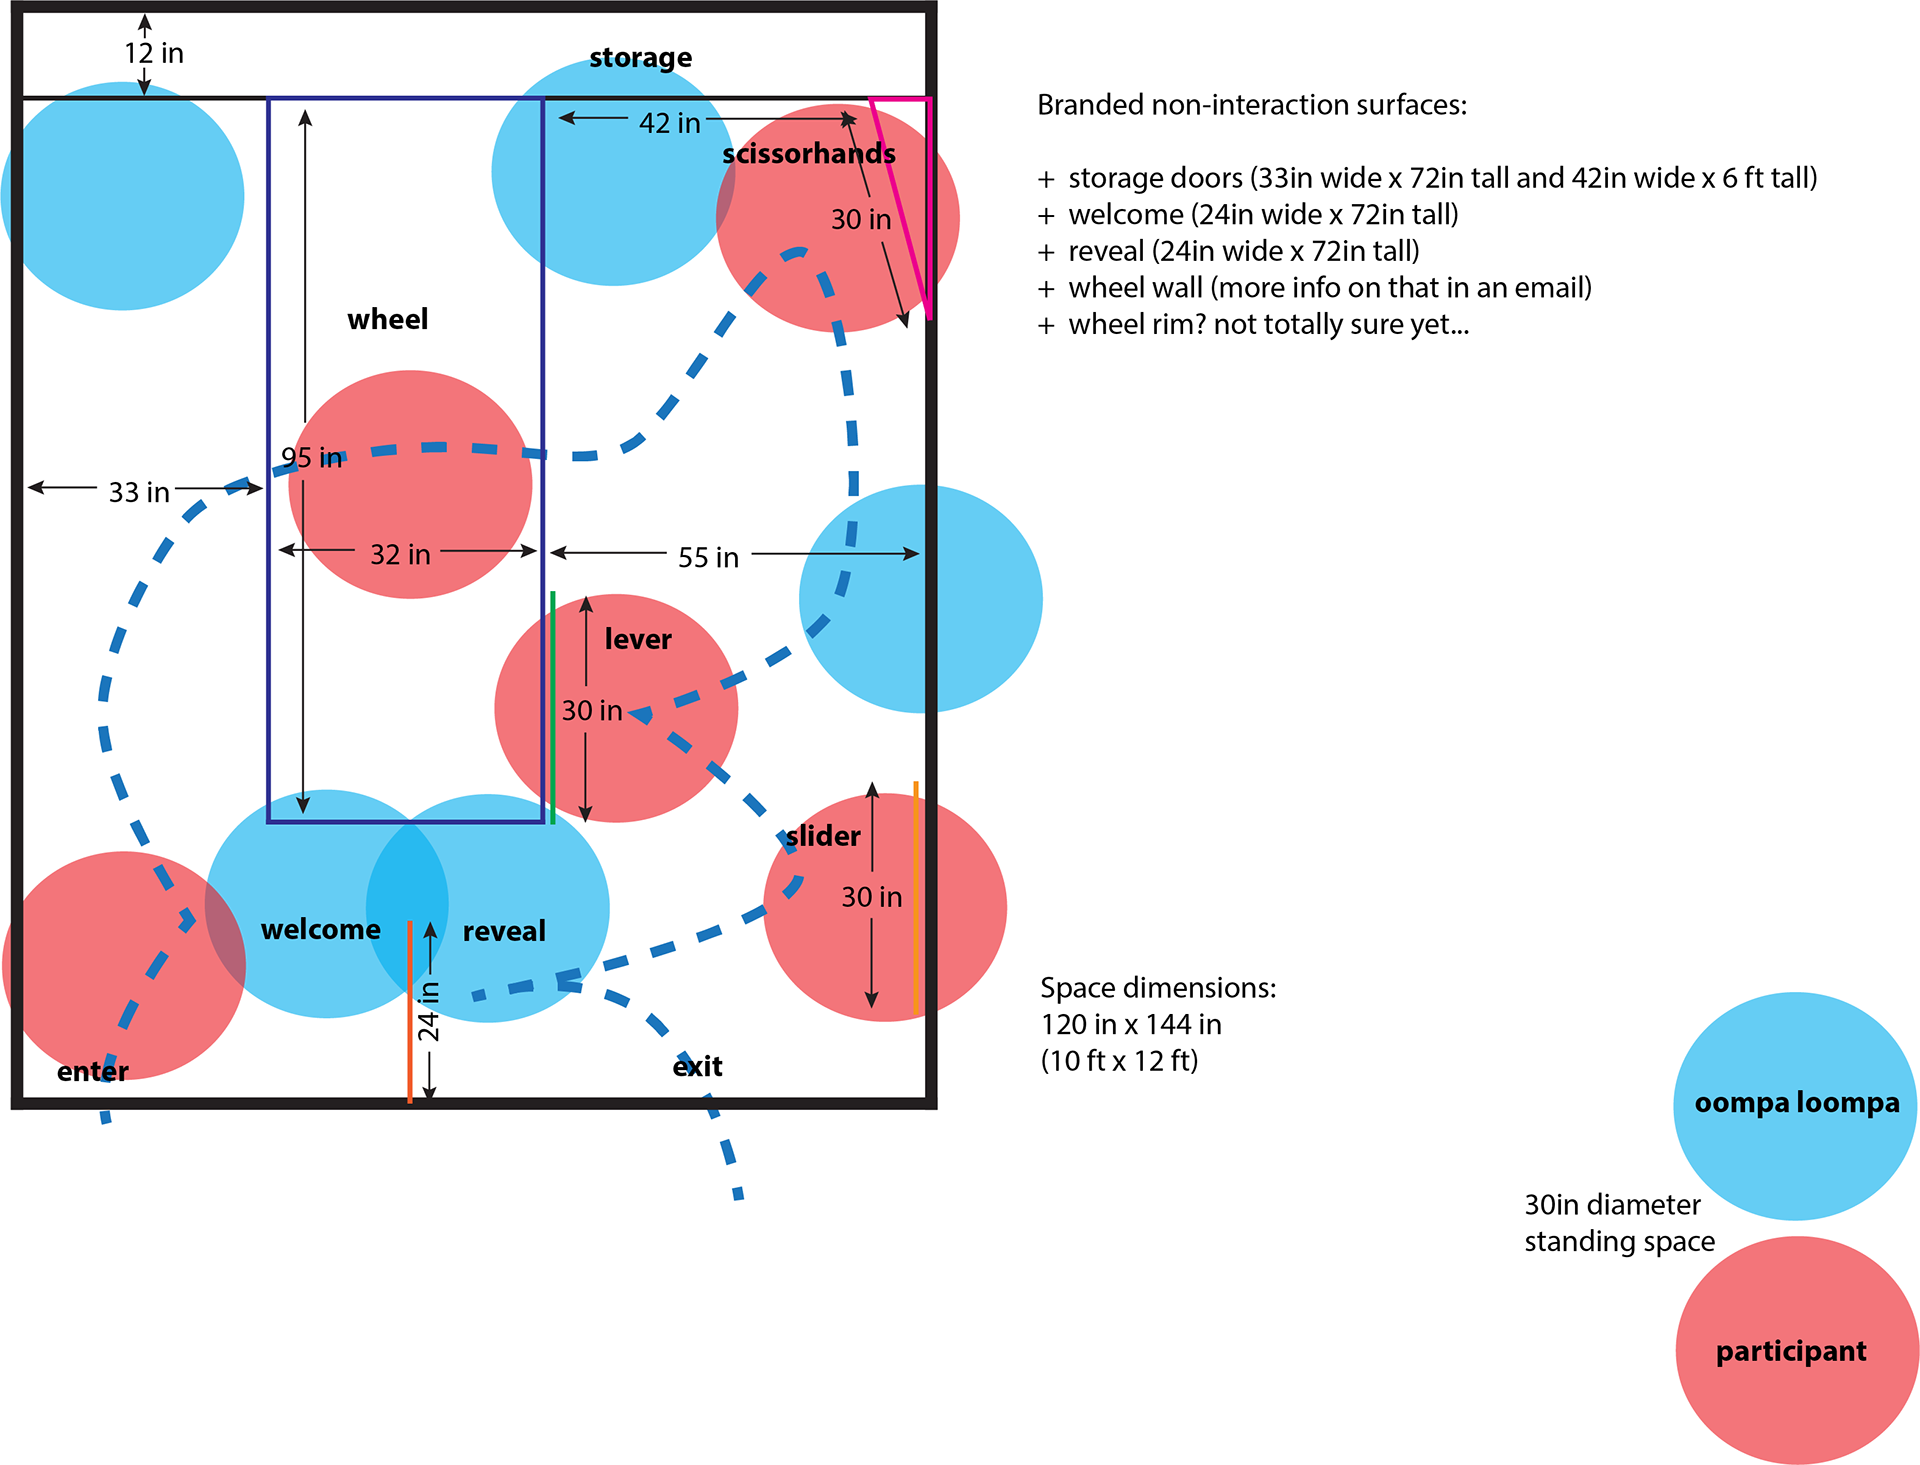
Final spatial flow diagram
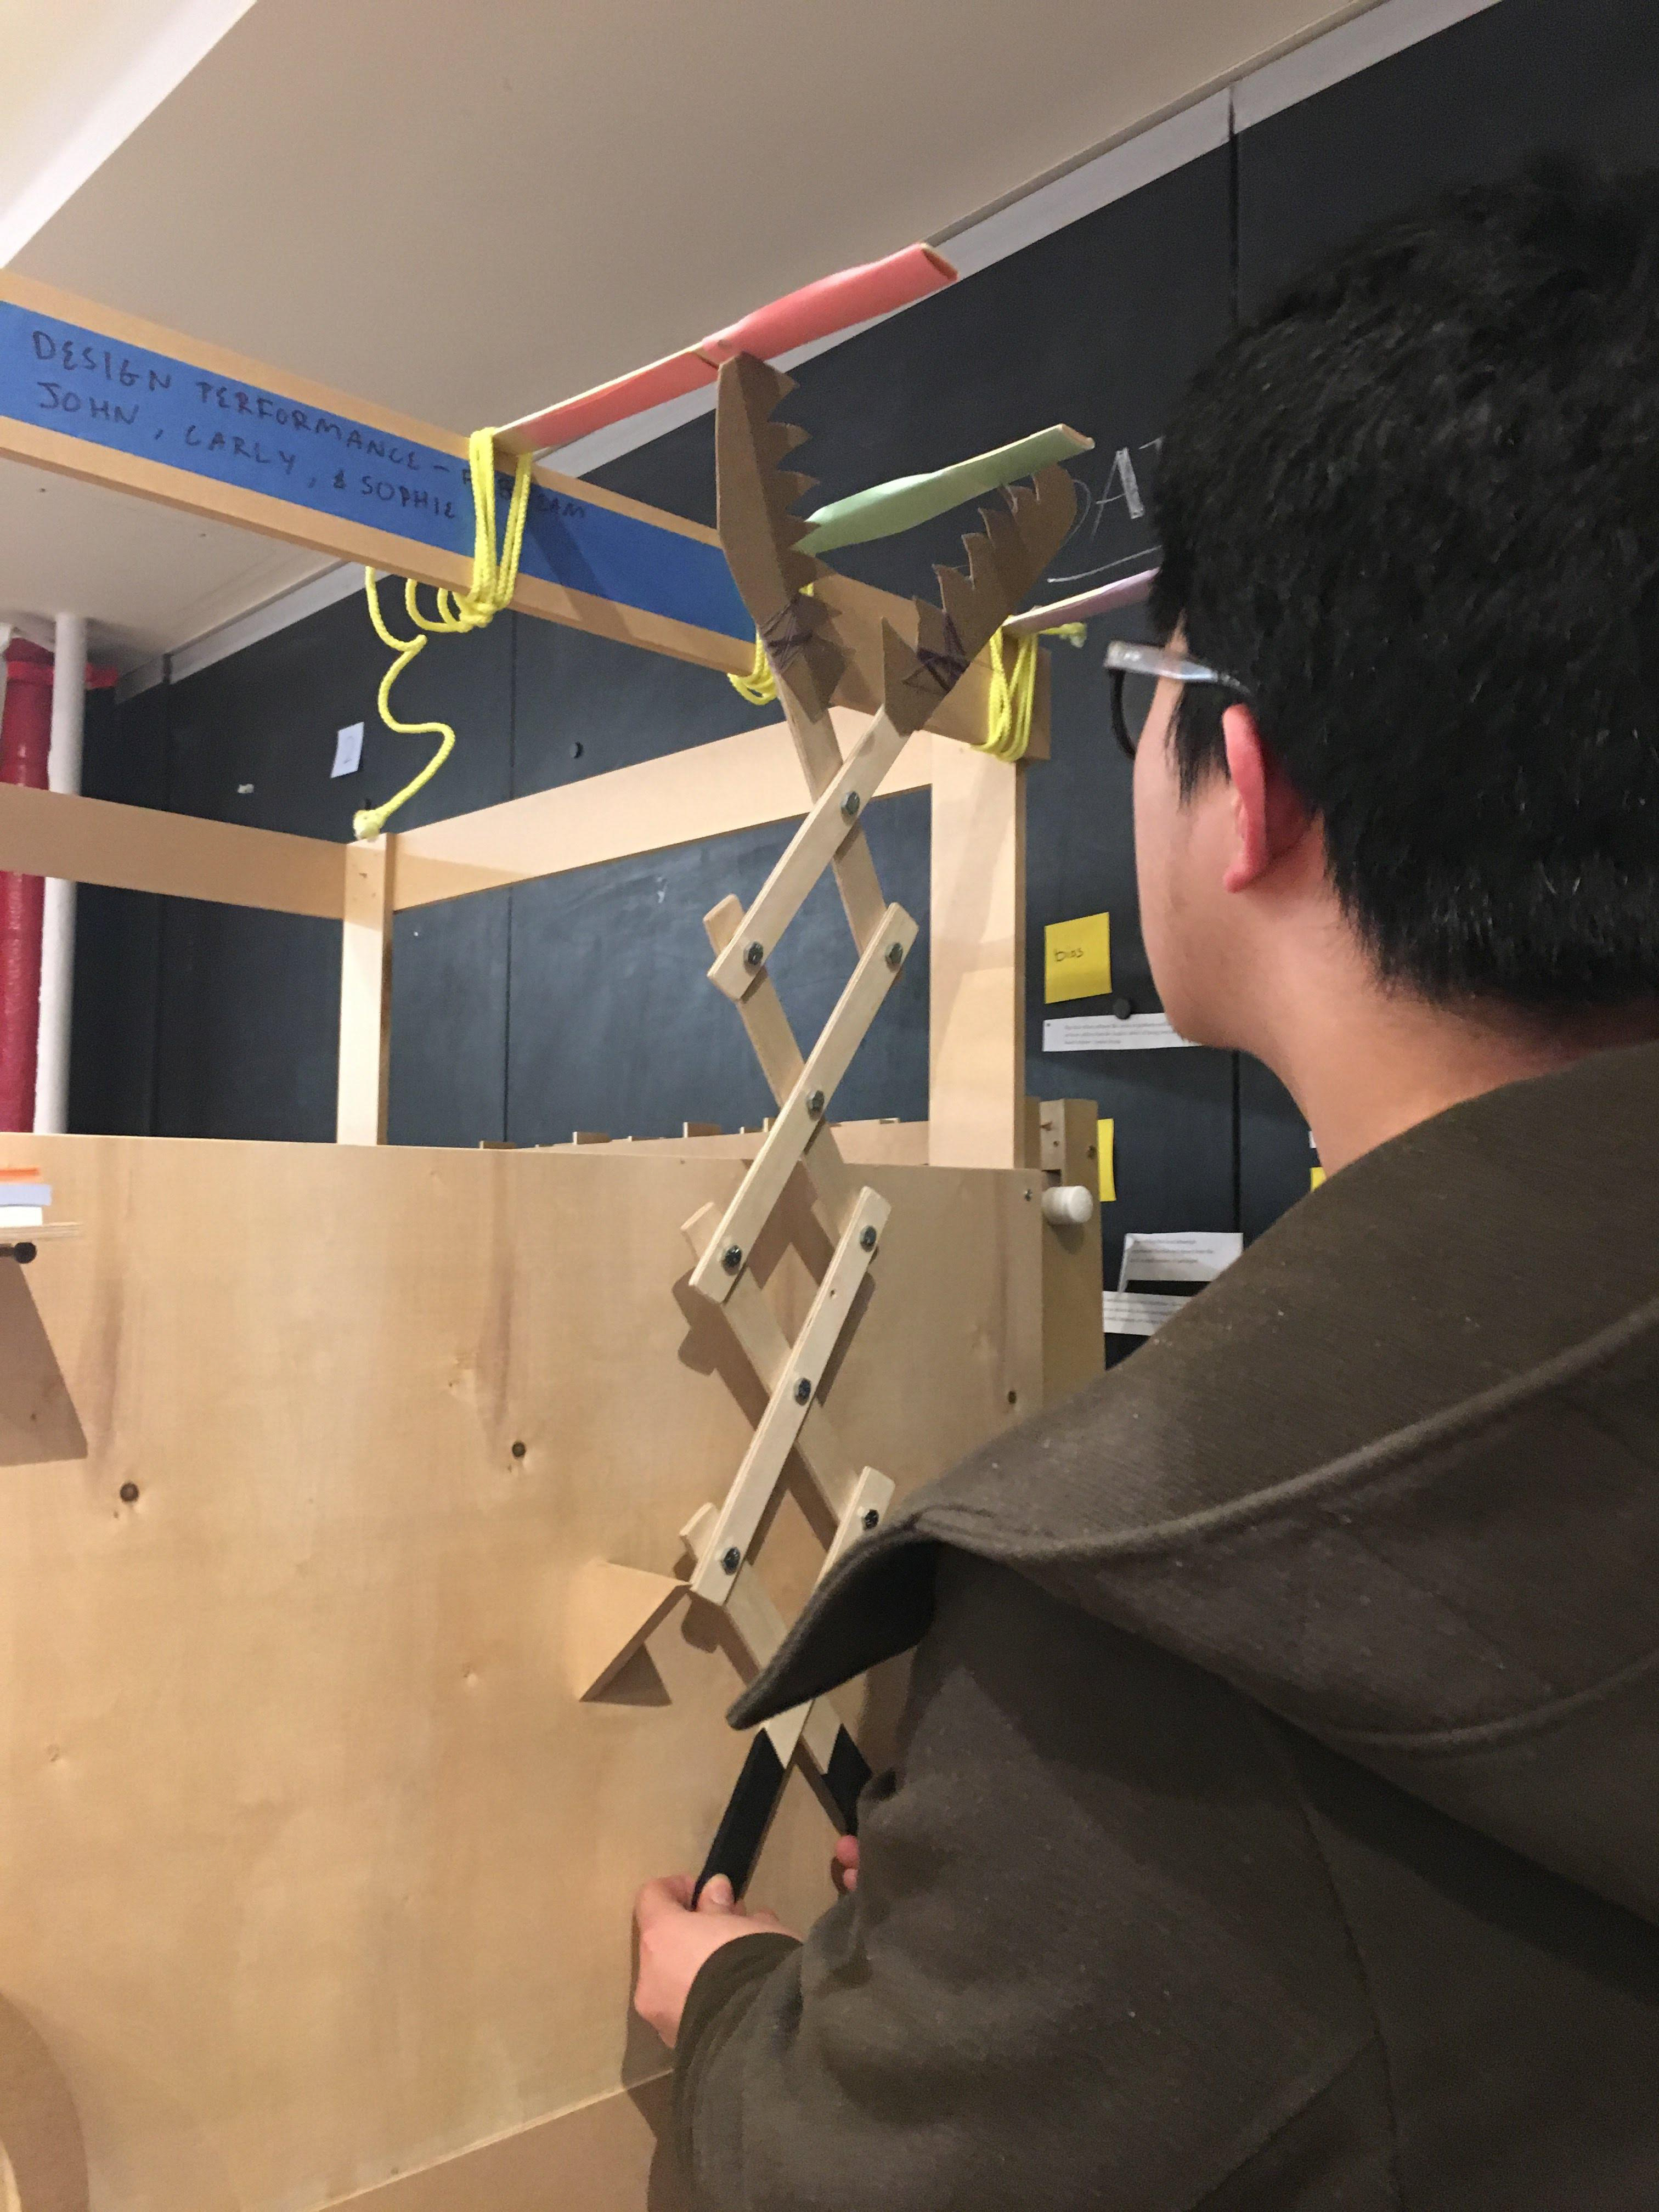
Claw prototype

Carly and Sophie with the crank prototype

Slider prototype
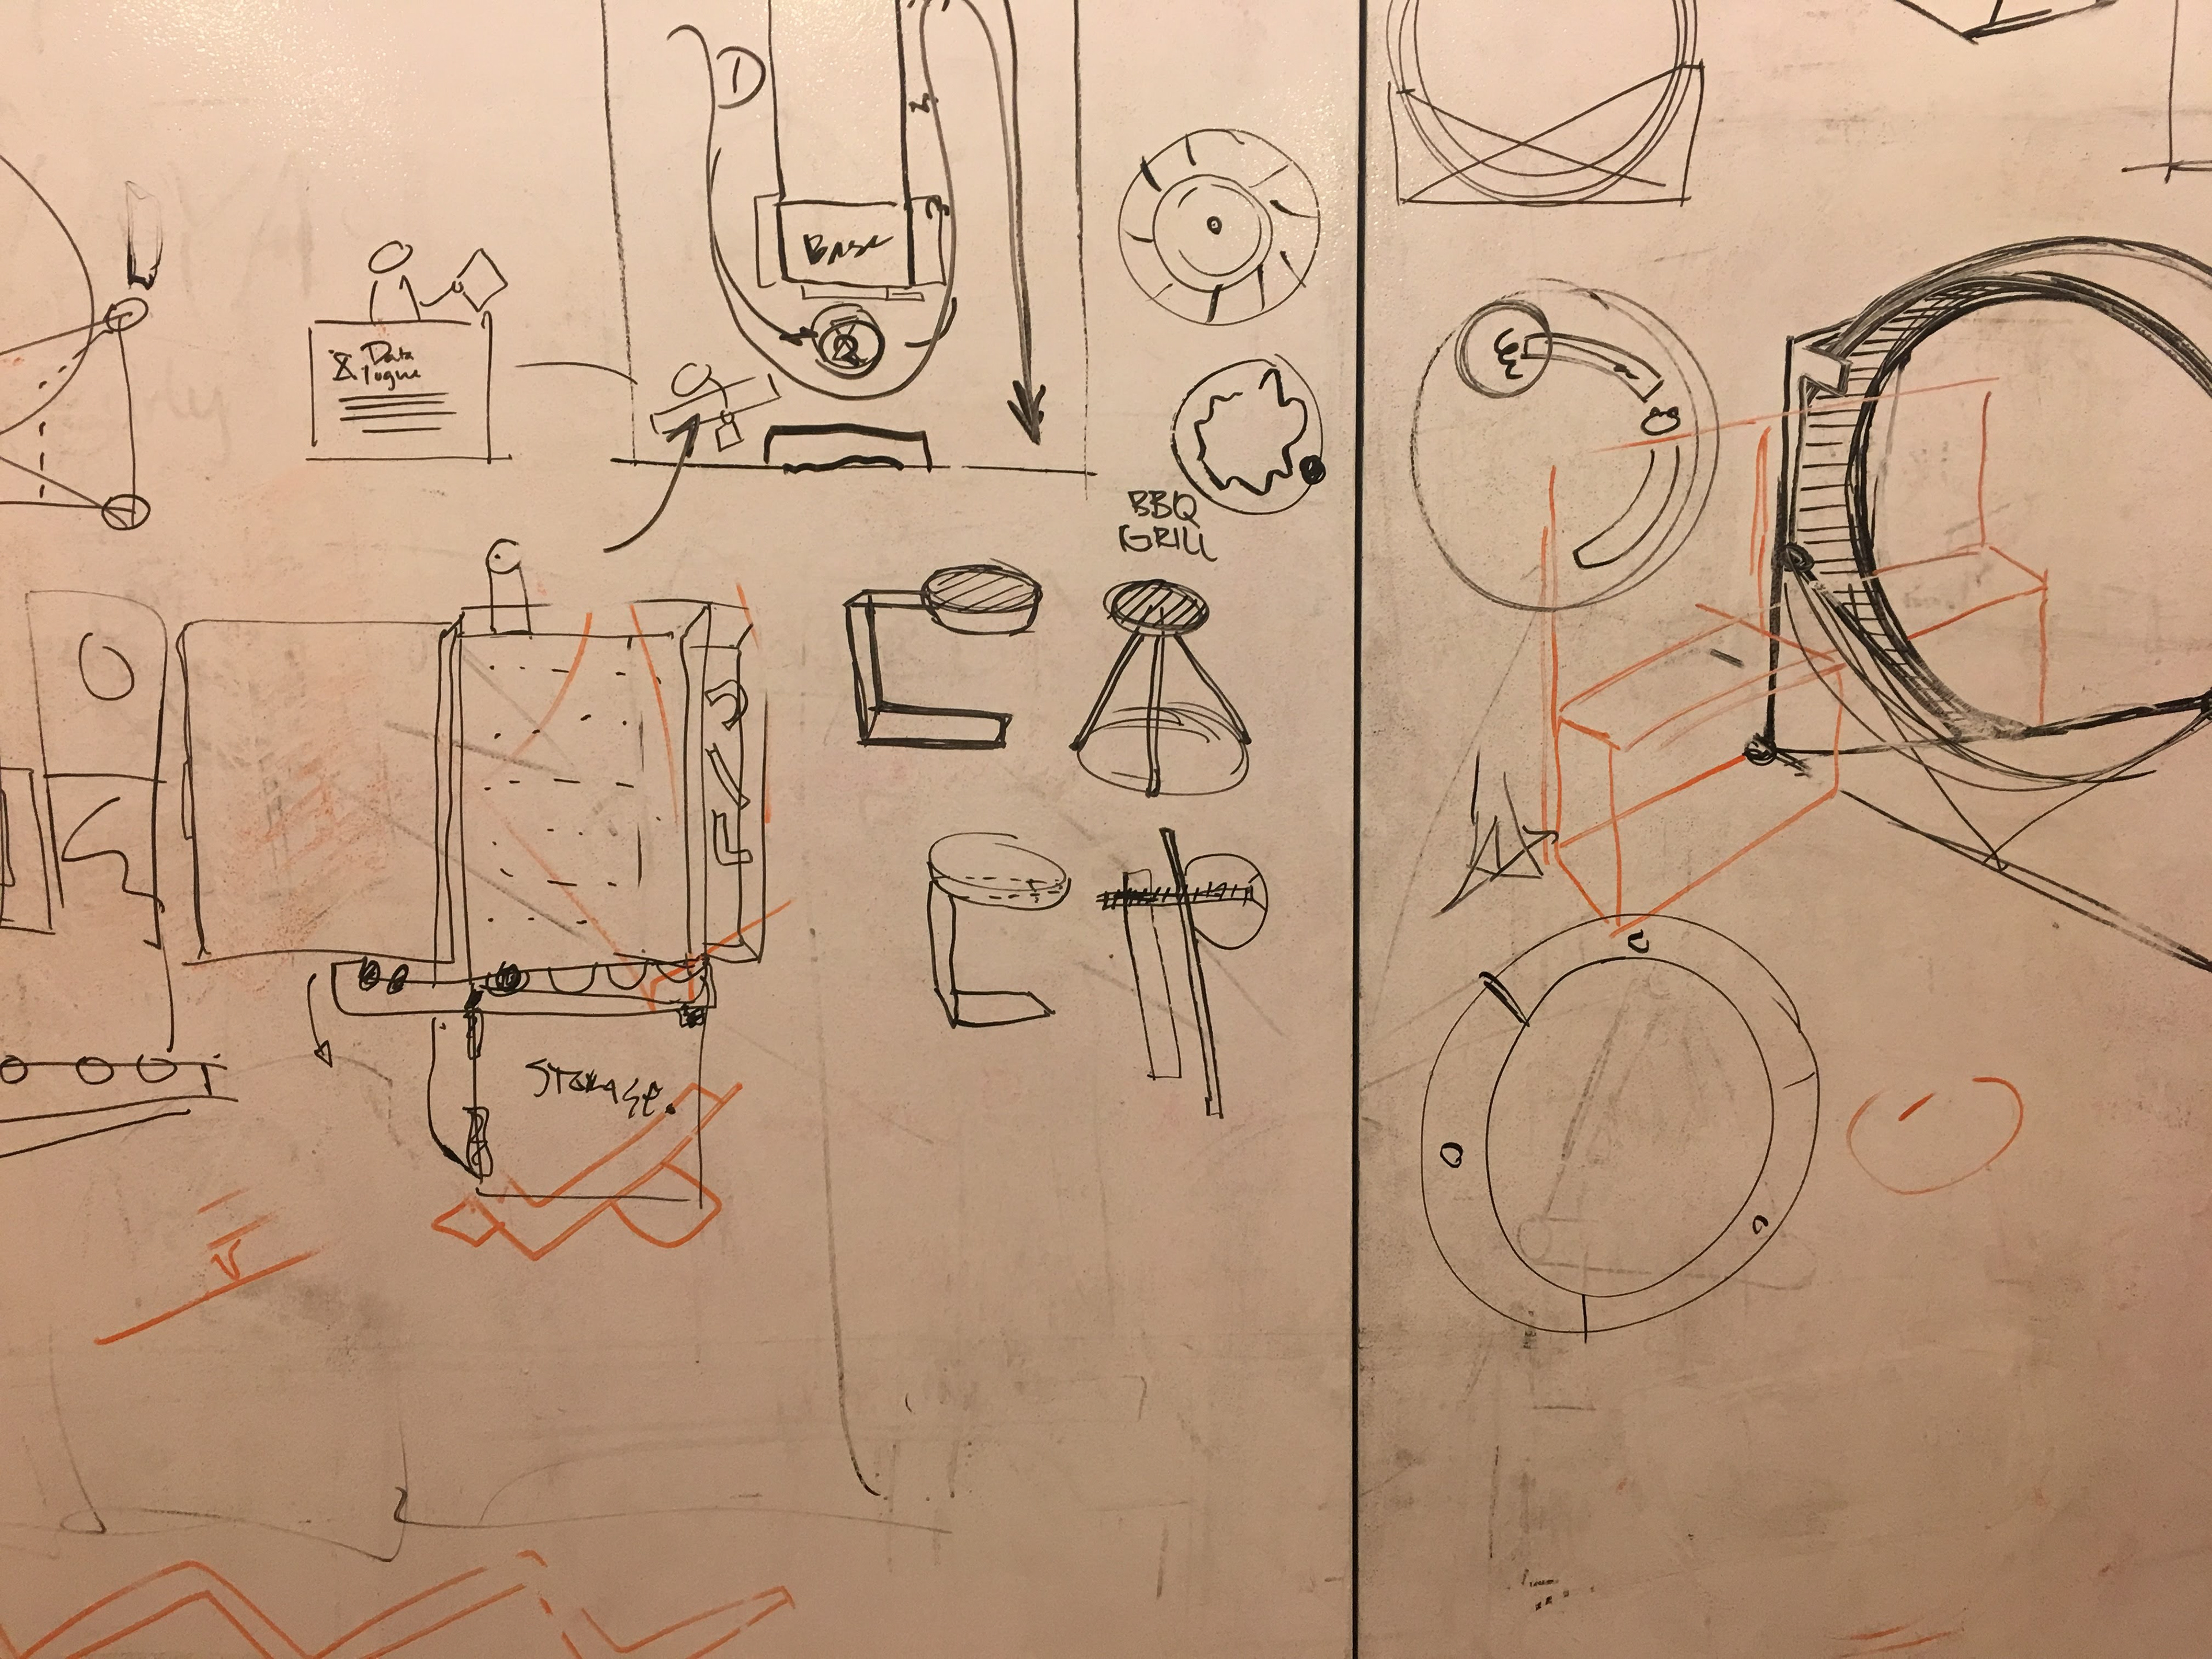
Accumulating whiteboard sketches
Celebrating the end of Wanted Design on our 8ft hamster wheel
Outcome
It somehow all came together for the five-day expo. The amazing work by the Wardrobe and Graphics & Branding subteams brought the experience to life. Over the course of the event, we guided hundreds of participants through The Datalogue using a semi-structured script that we had rehearsed many times prior to Wanted Design.
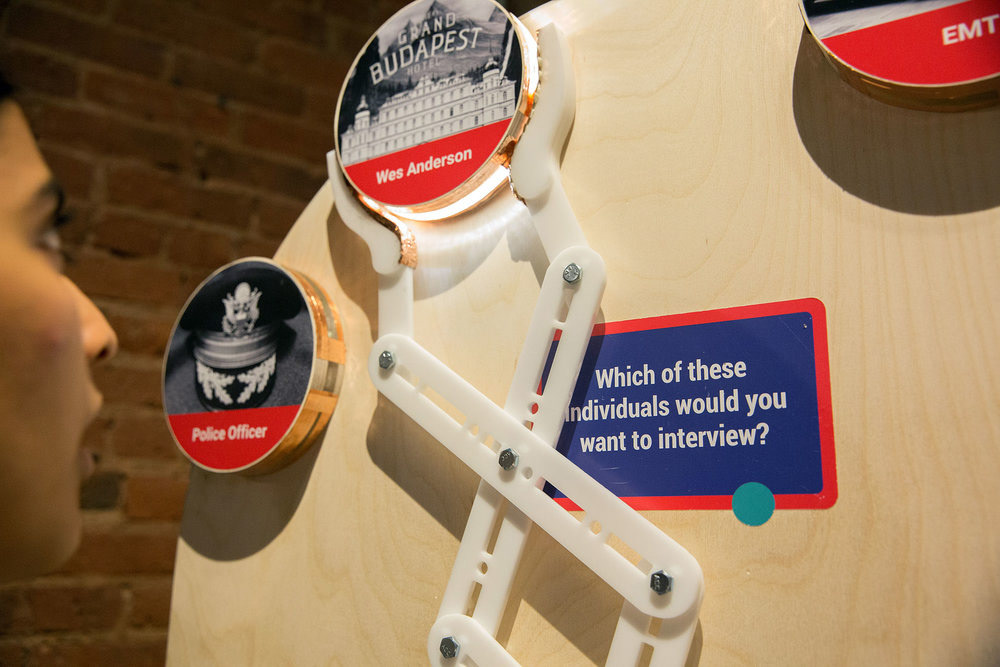
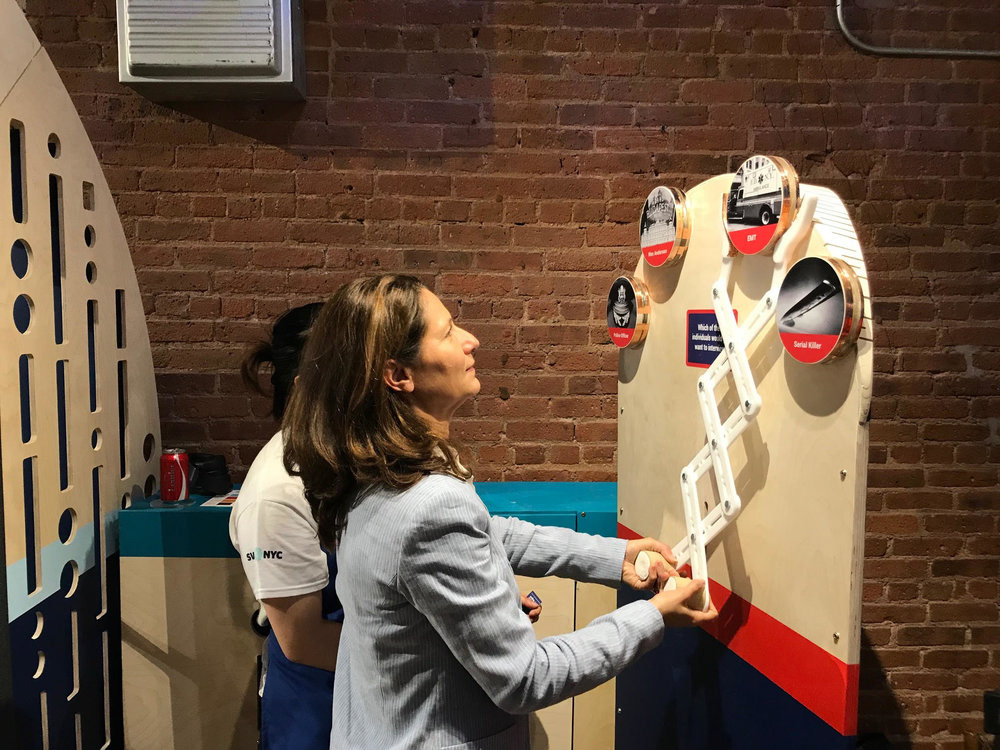
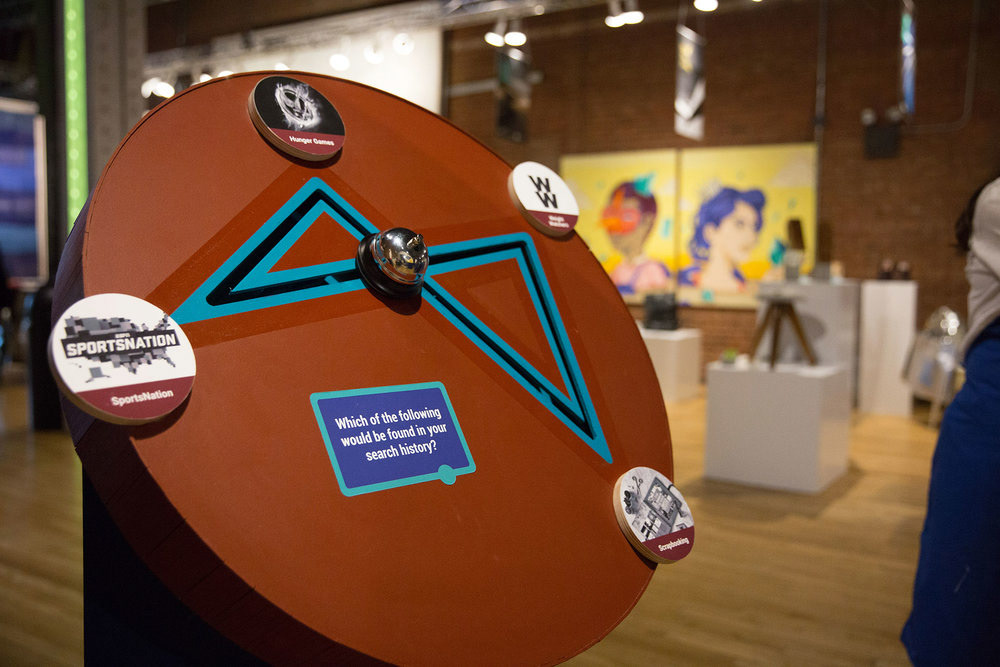
At each of the four stations, participants answered seemingly arbitrary multiple-choice questions using the carnival-style interactions.

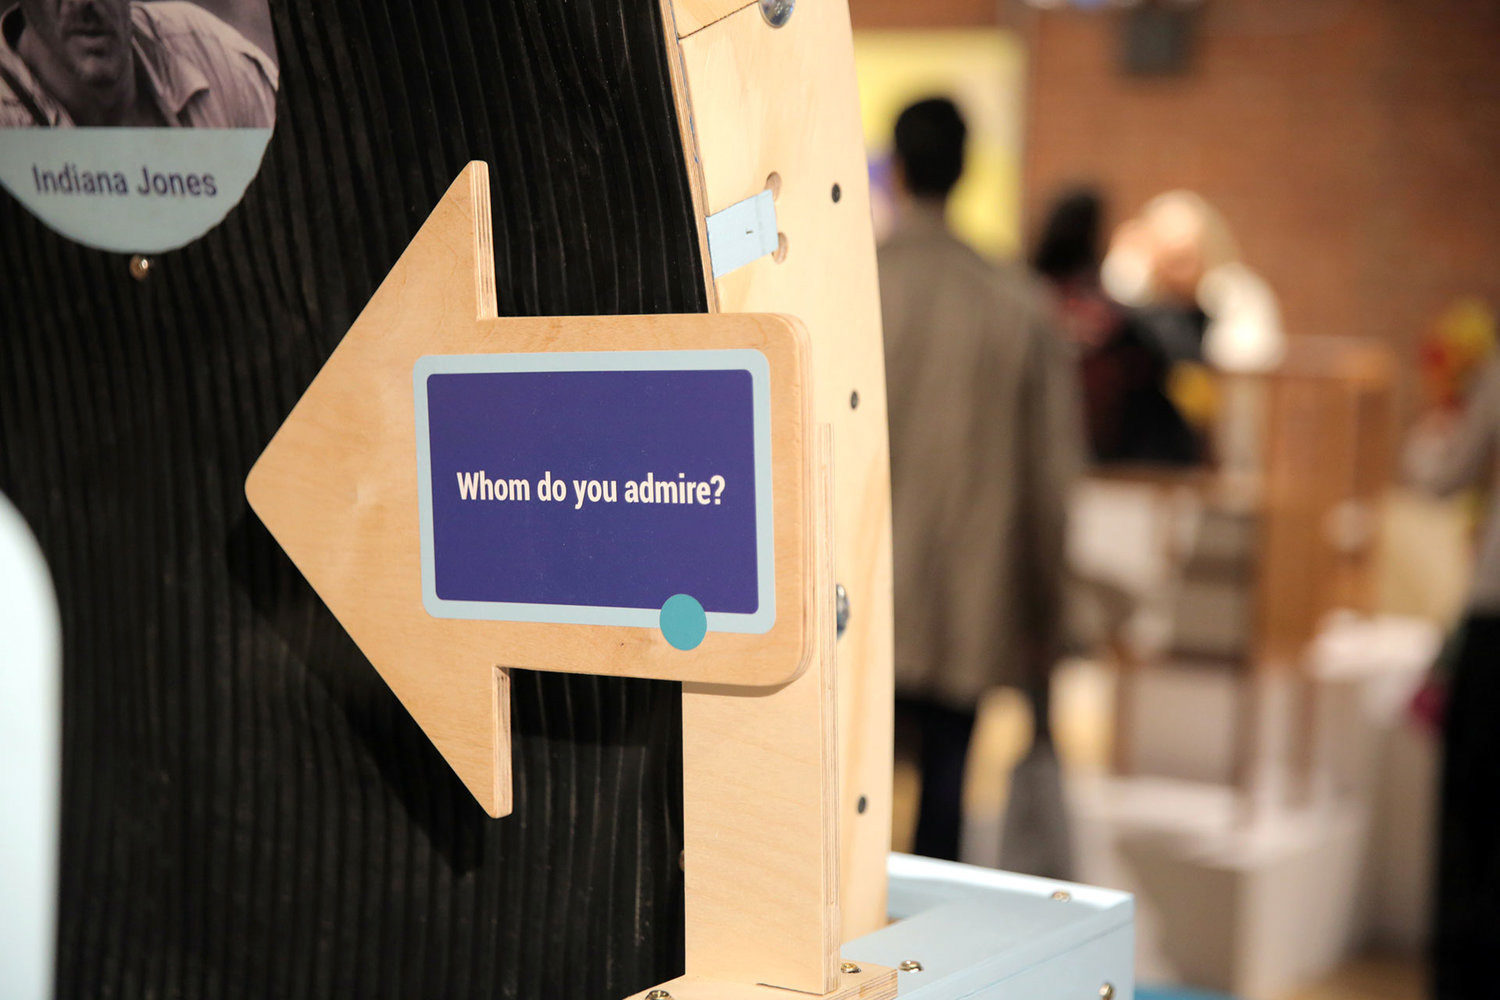
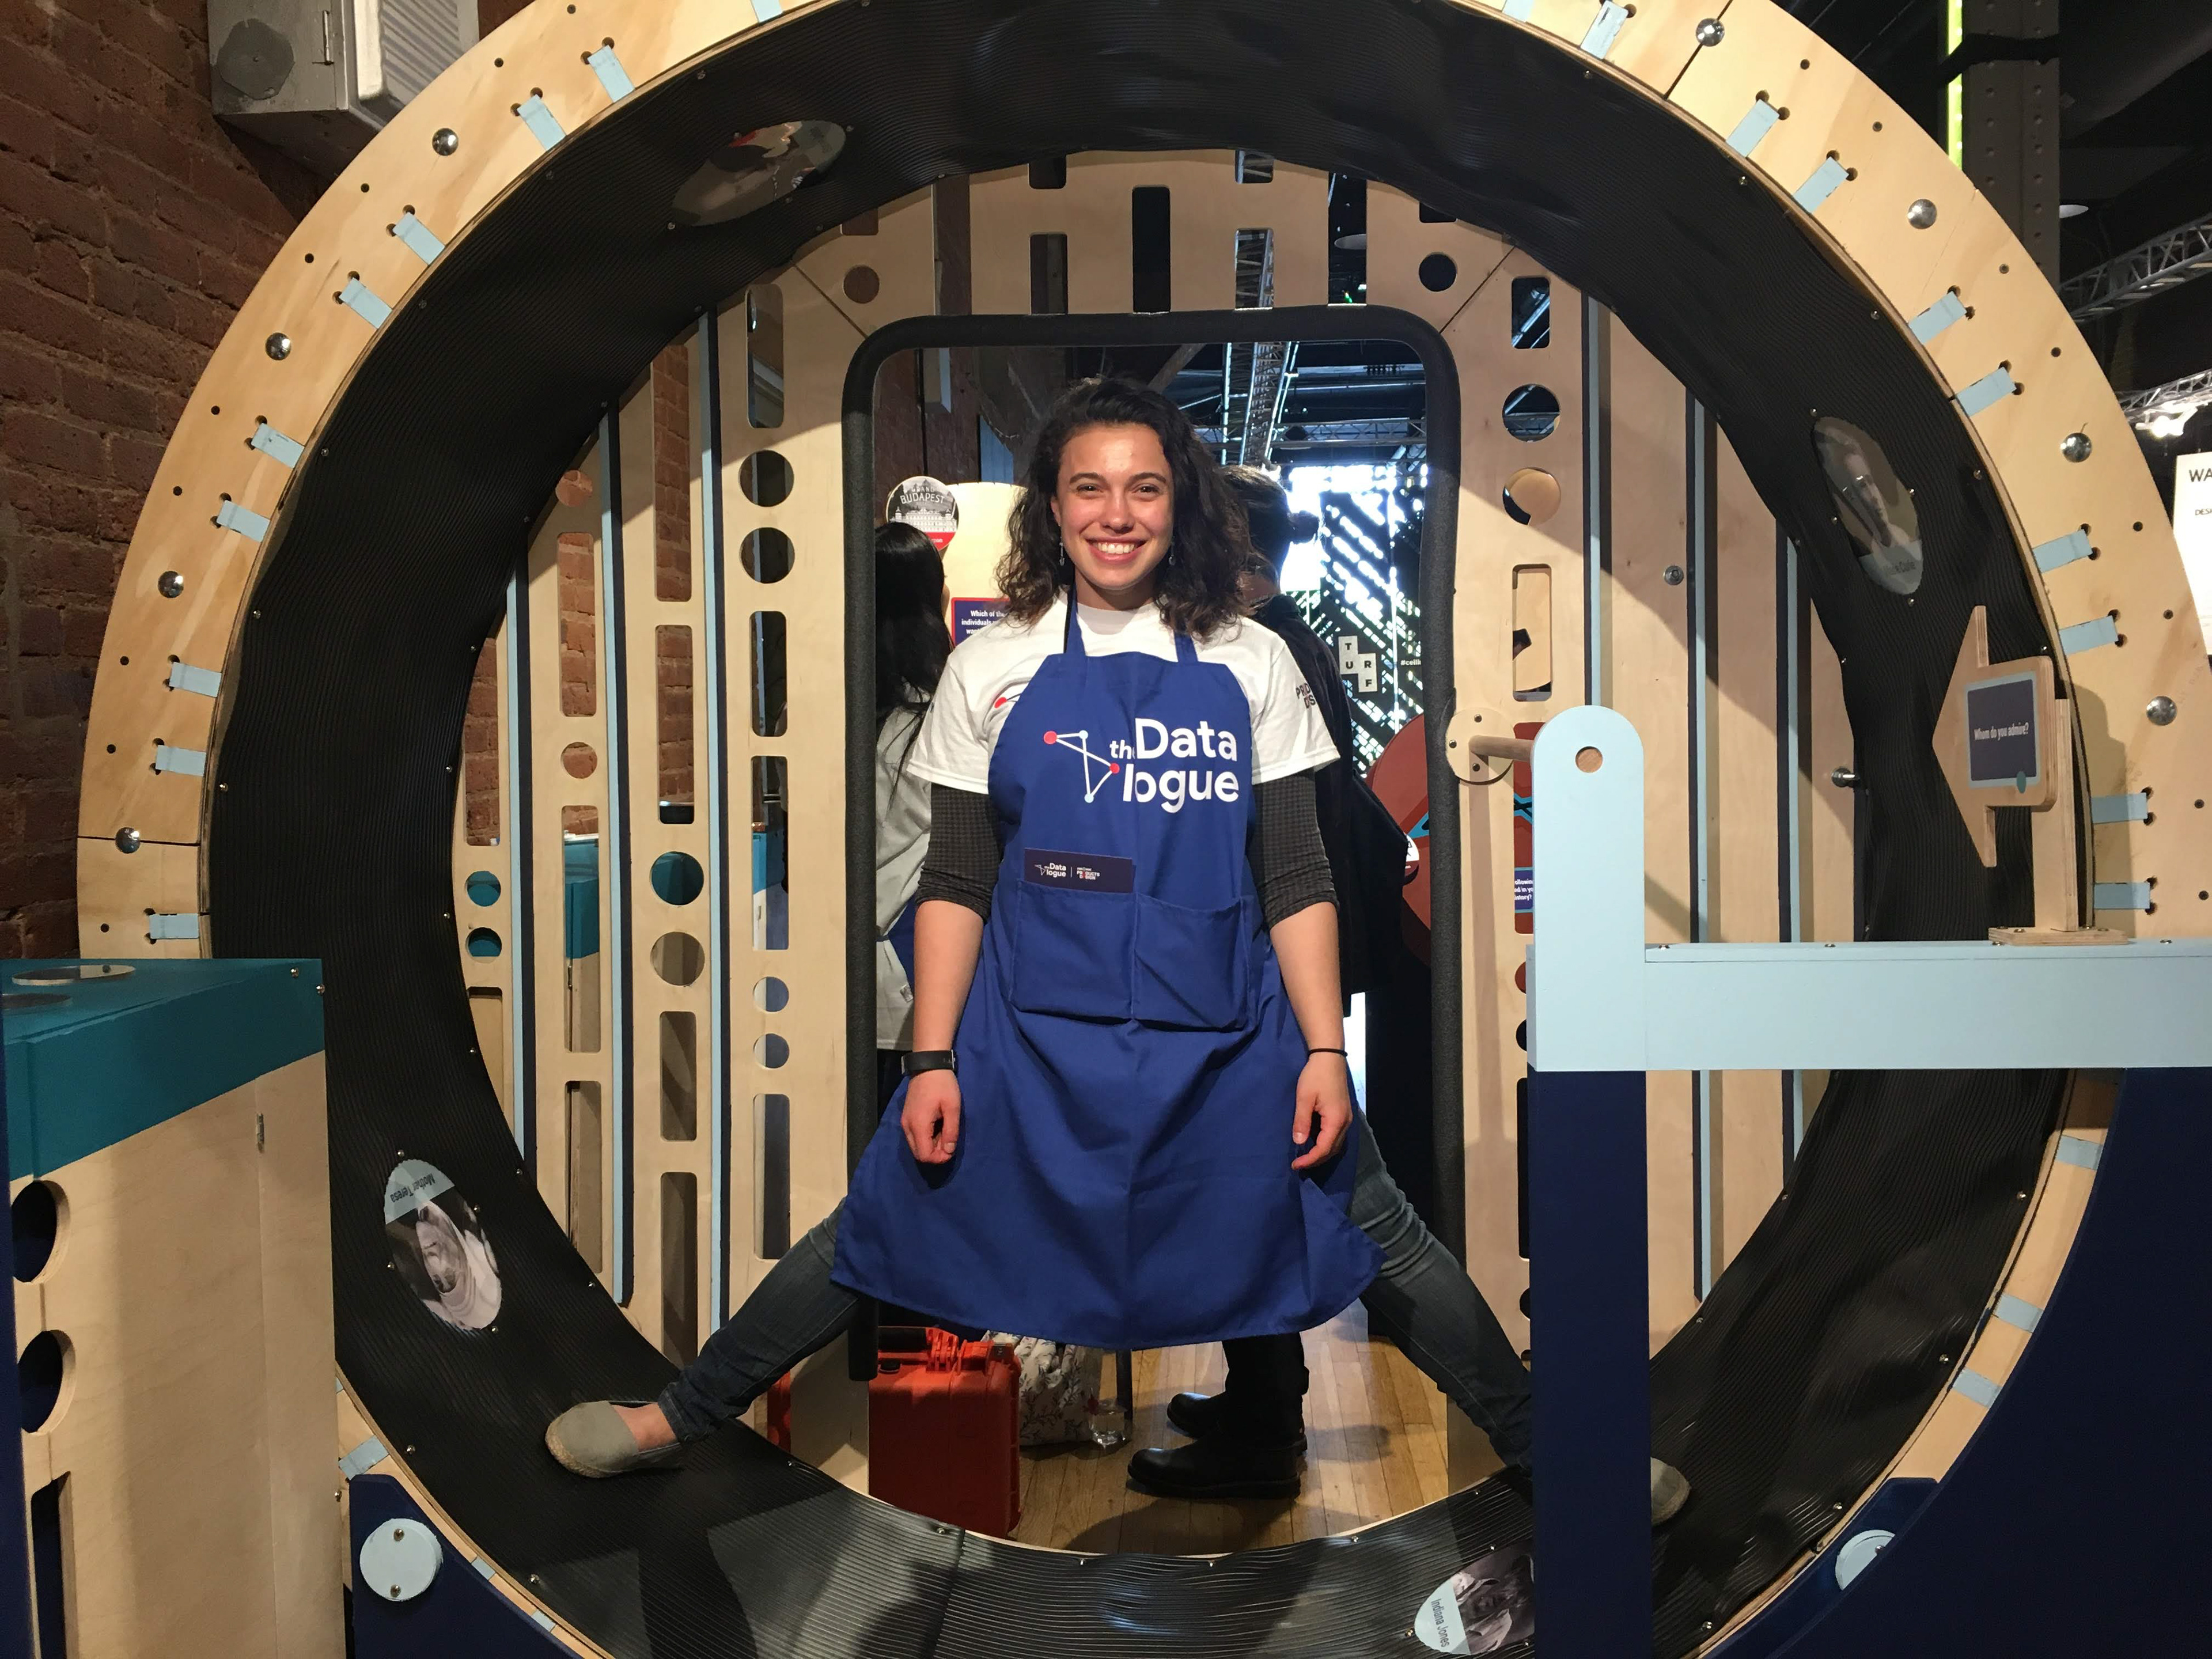
At the first interaction, the wheel, participants answered the question, "Whom do you admire?" After the participant selected their answer, the attendant punched their card and passed it with them through the tunnel to the next station.
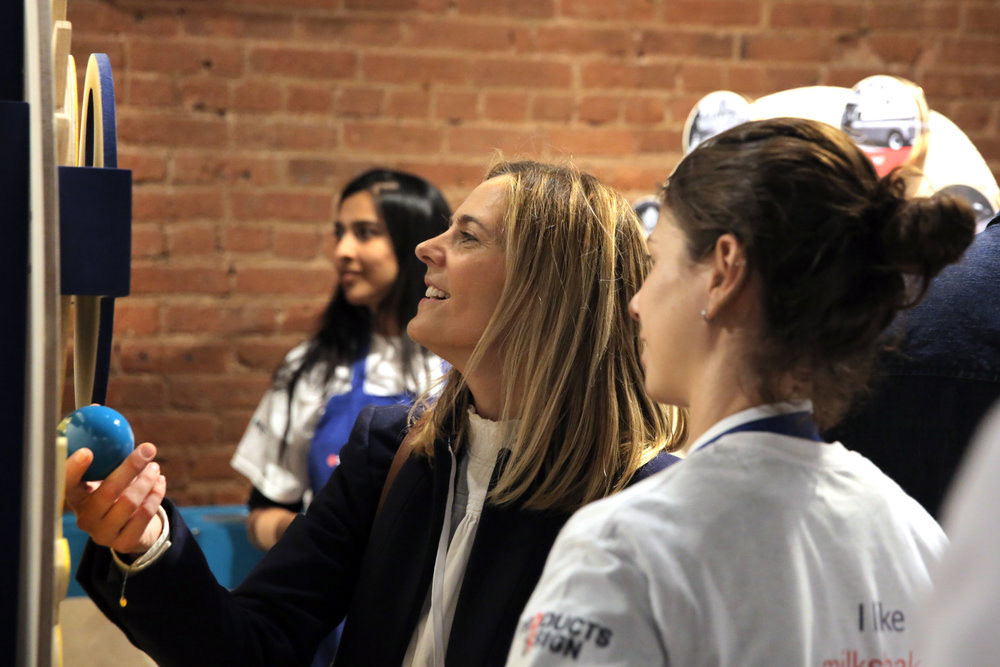
The next interaction was the Grabber. The participant would select their answer by lighting up the circle with the grabber hands.
At the Crank station, the exposed gears made a satisfying clicking sound when turned to select the answer.
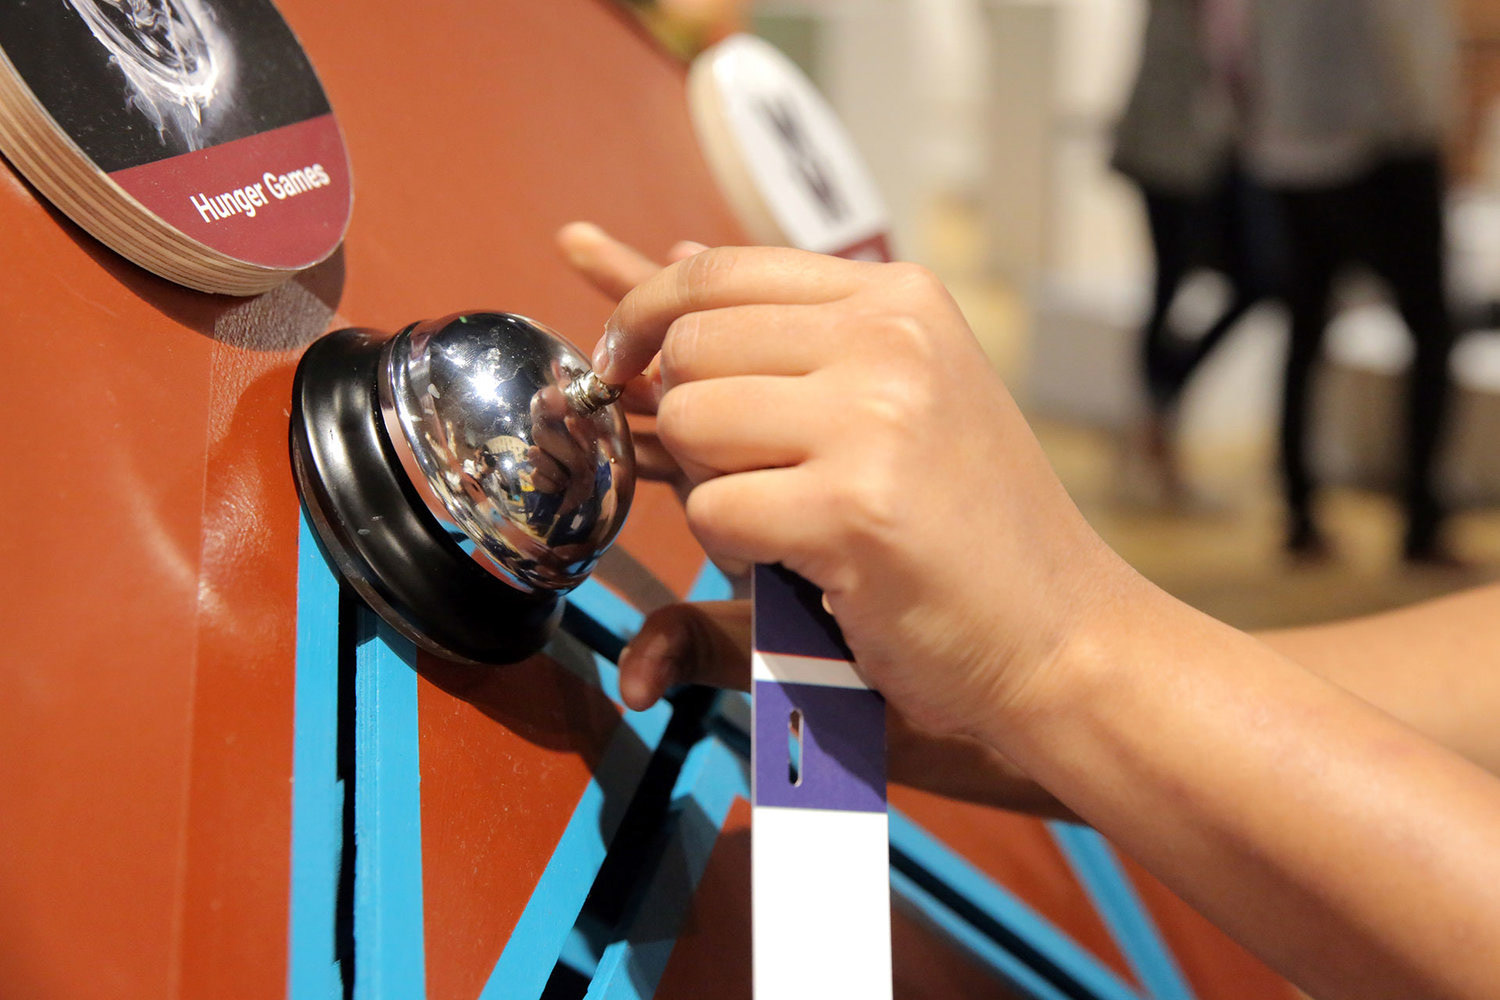
The Slider was the final interaction, where the participant would slide and ring a bell to make their selection.
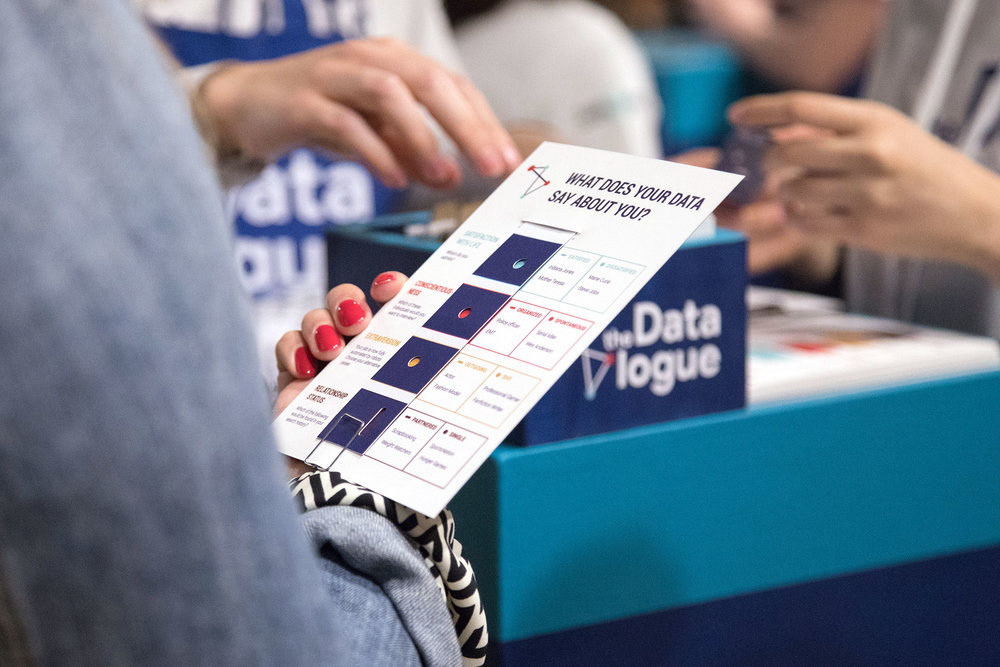
At the end, we revealed that all of the answers had been drawn from the Cambridge study published in the National Academy of Sciences, and correlated with four of the Big Five personality traits used by Cambridge Analytica. Specifically, participants' responses showed us whether they were satisfied or dissatisfied with life, organized or spontaneous, extraverted or introverted, and even their relationship status.
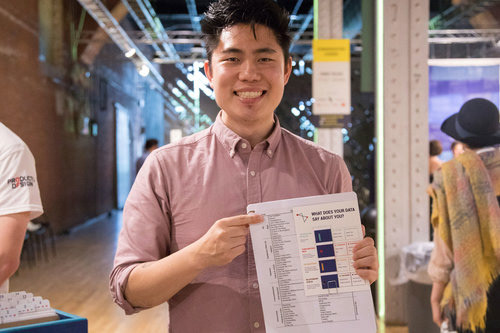
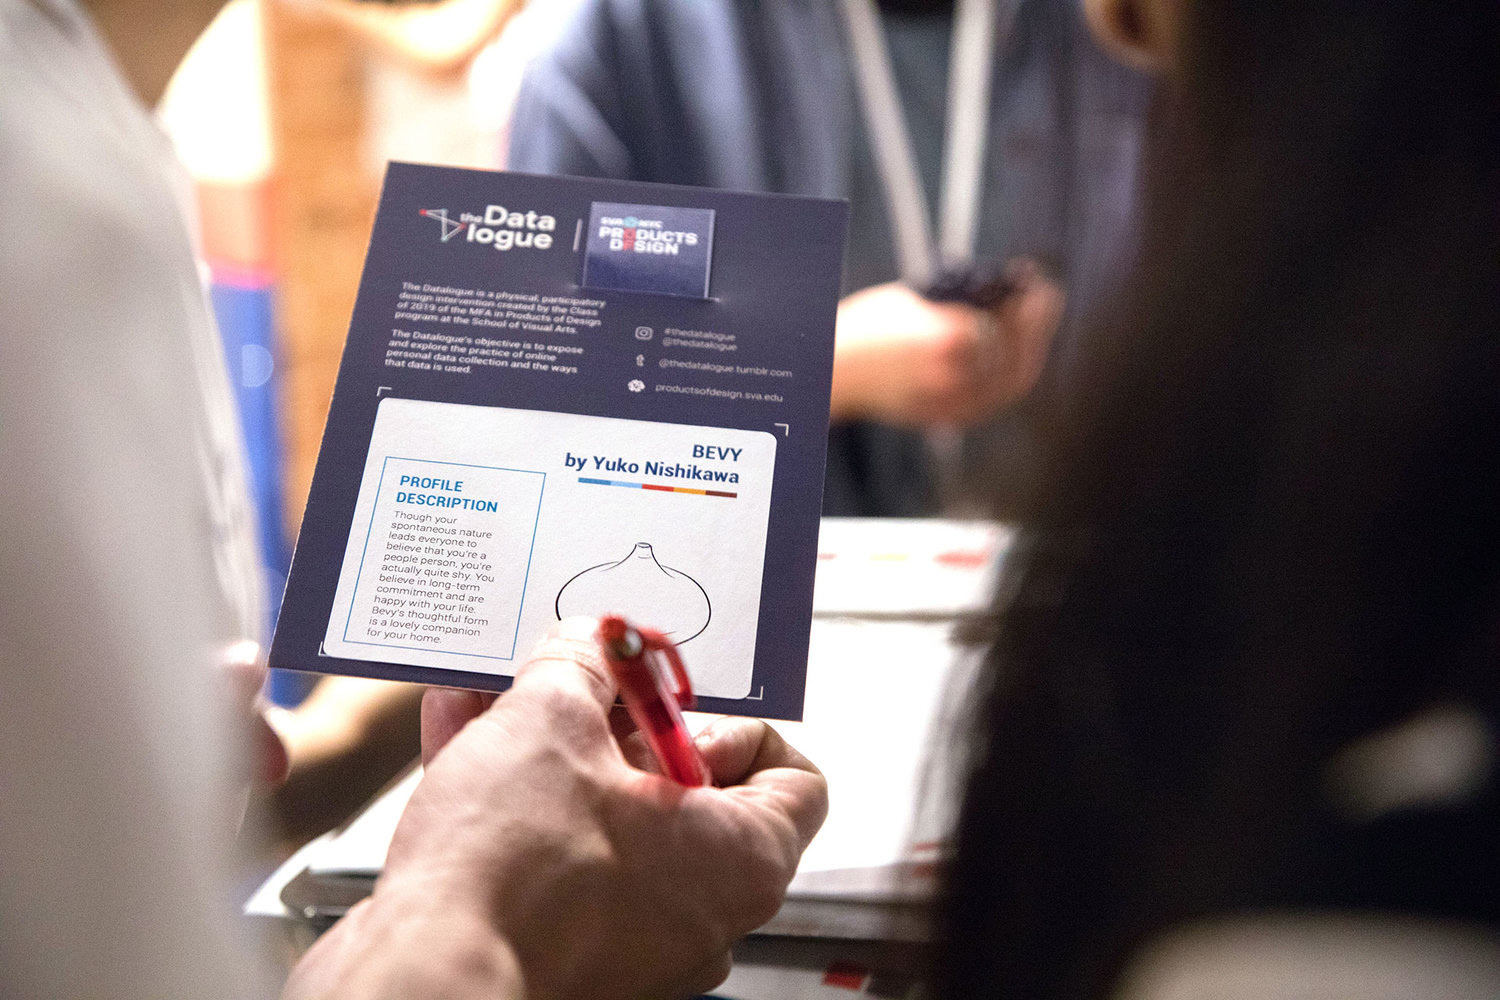
Participants generally came away surprised at the accuracy of their results. Additionally, to make the it site-specific, the Branding team had researched all of the furniture companies sharing the space with us at Wanted Design and correlated a piece of their furniture with one of the sixteen personality types identified by the four traits. Each participant received their results card with a sticker showing their furniture item and an original personality description. Wanted Design vendors loved when people showed up at their booths looking for the item with which we had matched them!
Credits
Huge shout out to my wonderful, amazing Fab Team: Eugenia Ramos Alonso, Ben Bartlett, Rhea Bhandari, John Boran, Sophie Carrillo Miranda, and Carly Simmons
Thank you to our instructor, Sinclair Smith, as well as our program chair Allan Chochinov.
Project management: Evie Cheung
Branding & Graphics: Phuong Anh Nguyen, Ellen Rose, Antya Waegemann, and Qixuan Wang
Wardrobe: Gustav Ole Dyrhauge, Tzu Ching Lin, and Yangying Ye
Photography: Micah Lynn (with Carly Simmons and Zihan Chen)
Videography: Zihan Chen
Social media: André Orta and Runshi Wei